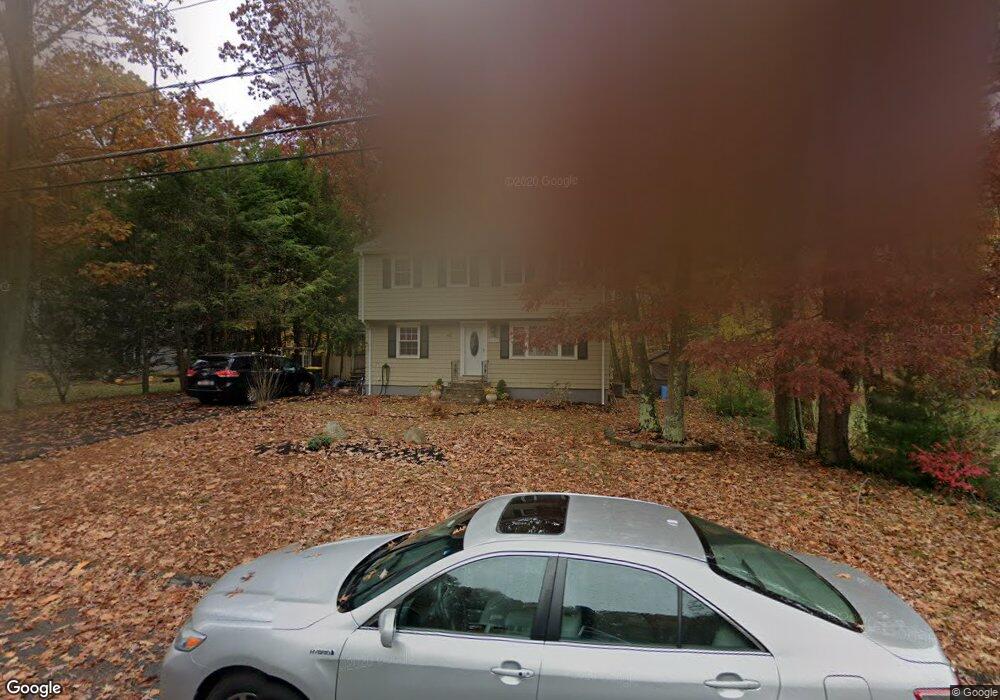
52 Southgate Rd Franklin, MA 02038
Estimated Value: $675,465 - $716,000
4
Beds
2
Baths
1,782
Sq Ft
$390/Sq Ft
Est. Value
About This Home
This home is located at 52 Southgate Rd, Franklin, MA 02038 and is currently estimated at $695,366, approximately $390 per square foot. 52 Southgate Rd is a home located in Norfolk County with nearby schools including John F. Kennedy Memorial School, Horace Mann Middle School, and Franklin High School.
Ownership History
Date
Name
Owned For
Owner Type
Purchase Details
Closed on
Jul 29, 2005
Sold by
Fncl Cendant Mobility
Bought by
Brahimi Mohamed and Brahimi Nidal
Current Estimated Value
Home Financials for this Owner
Home Financials are based on the most recent Mortgage that was taken out on this home.
Original Mortgage
$300,000
Outstanding Balance
$157,695
Interest Rate
5.67%
Mortgage Type
Purchase Money Mortgage
Estimated Equity
$537,671
Purchase Details
Closed on
Jan 25, 2000
Sold by
Ristaino Carl E and Ristaino Jean M
Bought by
Enright Michael T and Enright Kimberly A
Home Financials for this Owner
Home Financials are based on the most recent Mortgage that was taken out on this home.
Original Mortgage
$174,000
Interest Rate
7.84%
Mortgage Type
Purchase Money Mortgage
Create a Home Valuation Report for This Property
The Home Valuation Report is an in-depth analysis detailing your home's value as well as a comparison with similar homes in the area
Home Values in the Area
Average Home Value in this Area
Purchase History
| Date | Buyer | Sale Price | Title Company |
|---|---|---|---|
| Brahimi Mohamed | $375,000 | -- | |
| Cendant Mobilit Fncl C | $375,000 | -- | |
| Cendant Mobilit Fncl C | $375,000 | -- | |
| Enright Michael T | $227,900 | -- |
Source: Public Records
Mortgage History
| Date | Status | Borrower | Loan Amount |
|---|---|---|---|
| Open | Cendant Mobilit Fncl C | $300,000 | |
| Closed | Enright Michael T | $0 | |
| Previous Owner | Enright Michael T | $260,000 | |
| Previous Owner | Enright Michael T | $174,000 |
Source: Public Records
Tax History Compared to Growth
Tax History
| Year | Tax Paid | Tax Assessment Tax Assessment Total Assessment is a certain percentage of the fair market value that is determined by local assessors to be the total taxable value of land and additions on the property. | Land | Improvement |
|---|---|---|---|---|
| 2025 | $6,806 | $585,700 | $243,700 | $342,000 |
| 2024 | $6,007 | $509,500 | $243,700 | $265,800 |
| 2023 | $6,131 | $487,400 | $245,800 | $241,600 |
| 2022 | $5,843 | $415,900 | $203,100 | $212,800 |
| 2021 | $5,462 | $372,800 | $217,600 | $155,200 |
| 2020 | $5,325 | $367,000 | $219,500 | $147,500 |
| 2019 | $5,077 | $346,300 | $198,800 | $147,500 |
| 2018 | $4,931 | $336,600 | $204,500 | $132,100 |
| 2017 | $4,661 | $319,700 | $187,600 | $132,100 |
| 2016 | $4,259 | $293,700 | $184,500 | $109,200 |
| 2015 | $4,271 | $287,800 | $180,000 | $107,800 |
| 2014 | $3,743 | $259,000 | $151,200 | $107,800 |
Source: Public Records
Map
Nearby Homes
- 60 Southgate Rd
- 41 Kimberlee Ave
- 2 Noanet Brook Ln
- 951 Pond St
- 336 Maple St
- 208 Irondequoit Rd
- 2 Kayla Dr
- 0 Elm St
- 18 Mary Anne Dr
- 732 Lincoln St
- 7 Gloucester Dr
- 14 Hawthorne Village Unit D
- 24 Shayne Rd Unit 219
- 91 Oliver Pond Cir Unit 3
- 83 Oliver Pond Cir Unit 7
- 159 Highwood Dr
- 2 Skyline Dr
- 48 Leanne Way Unit 48
- 21 Riverside Rd
- 2211 Franklin Crossing Rd Unit 2211
- 50 Southgate Rd
- 54 Southgate Rd
- 6 Maple Tree Ln
- 56 Southgate Rd
- 48 Southgate Rd
- 51 Southgate Rd
- 49 Southgate Rd
- 58 Southgate Rd
- 46 Southgate Rd
- 4 Maple Tree Ln
- 10 Maple Tree Ln
- 47 Southgate Rd
- 55 Southgate Rd
- 45 Southgate Rd
- 44 Southgate Rd
- 12 Maple Tree Ln
- 2 Maple Tree Ln
- 7 Oak Tree Ln
- 9 Maple Tree Ln
- 43 Southgate Rd