
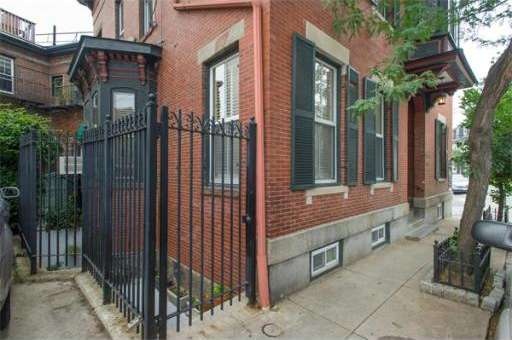
52 Sullivan St Unit 4 Charlestown, MA 02129
Medford Street-The Neck Neighborhood
2
Beds
1
Bath
890
Sq Ft
871
Sq Ft Lot
About This Home
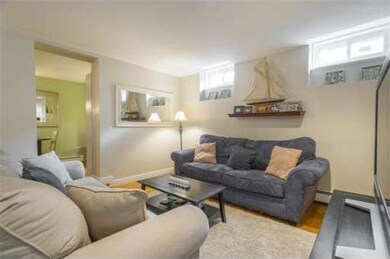
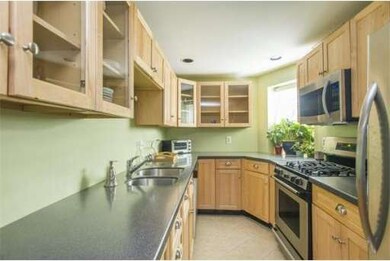
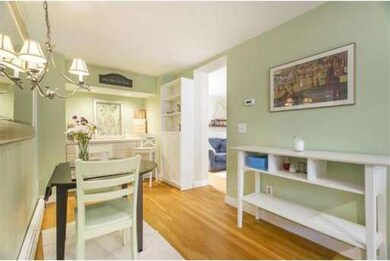
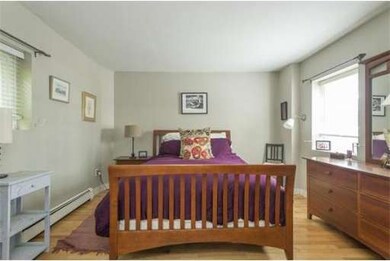
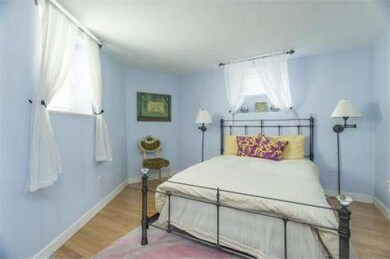
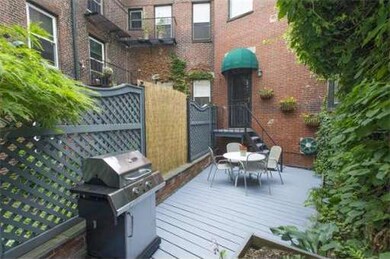
As of July 2019Centrally located near shops, restaurants & parks, a picturesque iron gate leads you to a flower filled private entrance unit located in an 1857 Victorian mansion! Two generous bedrooms, nicely separated for privacy, good size kitchen w/SS appliances & maple cabinetry is open to your dining area with built-ins which makes a great entertaining area! Hardwood floors throughout, updated bath, in unit W/D and a welcoming shared deck which is nicely landscaped is a perfect city oasis! Great Value!
Ownership History
Date
Name
Owned For
Owner Type
Purchase Details
Listed on
Jul 16, 2019
Closed on
Jul 24, 2019
Sold by
Baumbach Alexander
Bought by
Vanstry Jennifer
Seller's Agent
Lesley Smith
Barrett Sotheby's International Realty
Buyer's Agent
Kirby Taylor Team
Fortune RE
Sold Price
$3,000
Total Days on Market
6
Current Estimated Value
Home Financials for this Owner
Home Financials are based on the most recent Mortgage that was taken out on this home.
Estimated Appreciation
$738,027
Avg. Annual Appreciation
5.07%
Original Mortgage
$330,000
Outstanding Balance
$292,129
Interest Rate
3.7%
Mortgage Type
Stand Alone Refi Refinance Of Original Loan
Estimated Equity
$448,635
Purchase Details
Listed on
Apr 20, 2016
Closed on
Jul 15, 2016
Sold by
Andruskiewicz Brian and Minnis Sara
Bought by
Baumbach Alexander
Seller's Agent
Collin Bray
Century 21 Cityside
Buyer's Agent
Martha Toti
Coldwell Banker Realty - Boston
List Price
$490,000
Sold Price
$485,000
Premium/Discount to List
-$5,000
-1.02%
Home Financials for this Owner
Home Financials are based on the most recent Mortgage that was taken out on this home.
Avg. Annual Appreciation
4.53%
Original Mortgage
$363,750
Interest Rate
3.66%
Mortgage Type
New Conventional
Purchase Details
Listed on
Jul 11, 2013
Closed on
Sep 6, 2013
Sold by
Bishop Kevin E and Bishop Kelly J
Bought by
Andruskjewicz Brian and Minnis Sara
Seller's Agent
Tracy Shea
Coldwell Banker Realty - Boston
Buyer's Agent
Collin Bray
Century 21 Cityside
List Price
$385,000
Sold Price
$392,000
Premium/Discount to List
$7,000
1.82%
Home Financials for this Owner
Home Financials are based on the most recent Mortgage that was taken out on this home.
Avg. Annual Appreciation
7.73%
Original Mortgage
$352,800
Interest Rate
4.34%
Mortgage Type
New Conventional
Purchase Details
Closed on
Jul 29, 2005
Sold by
Callahan Kathleen
Bought by
Miller Kelly and Bishop Kevin E
Home Financials for this Owner
Home Financials are based on the most recent Mortgage that was taken out on this home.
Original Mortgage
$304,000
Interest Rate
5.67%
Mortgage Type
Purchase Money Mortgage
Purchase Details
Closed on
Jul 20, 2001
Sold by
Ericson Jon
Bought by
Callahan Kathleen P
Home Financials for this Owner
Home Financials are based on the most recent Mortgage that was taken out on this home.
Original Mortgage
$139,000
Interest Rate
7.2%
Mortgage Type
Purchase Money Mortgage
Purchase Details
Closed on
Dec 15, 1999
Sold by
Ezekiel John W and Mccoll Karen R
Bought by
Ericson Jon and Ericson Bernadette F
Purchase Details
Closed on
Dec 16, 1997
Sold by
Bailey Anne M
Bought by
Ezekiel John W
Home Financials for this Owner
Home Financials are based on the most recent Mortgage that was taken out on this home.
Original Mortgage
$109,250
Interest Rate
7.14%
Mortgage Type
Purchase Money Mortgage
Similar Homes in the area
Create a Home Valuation Report for This Property
The Home Valuation Report is an in-depth analysis detailing your home's value as well as a comparison with similar homes in the area
Home Values in the Area
Average Home Value in this Area
Purchase History
| Date | Type | Sale Price | Title Company |
|---|---|---|---|
| Condominium Deed | $555,000 | -- | |
| Not Resolvable | $485,000 | -- | |
| Deed | $392,000 | -- | |
| Deed | $392,000 | -- | |
| Land Court Massachusetts | $380,000 | -- | |
| Land Court Massachusetts | $239,000 | -- | |
| Land Court Massachusetts | $189,450 | -- | |
| Leasehold Conv With Agreement Of Sale Fee Purchase Hawaii | $115,000 | -- |
Source: Public Records
Mortgage History
| Date | Status | Loan Amount | Loan Type |
|---|---|---|---|
| Open | $330,000 | Stand Alone Refi Refinance Of Original Loan | |
| Closed | $330,000 | New Conventional | |
| Previous Owner | $363,750 | New Conventional | |
| Previous Owner | $72,750 | Credit Line Revolving | |
| Previous Owner | $347,500 | Stand Alone Refi Refinance Of Original Loan | |
| Previous Owner | $352,800 | New Conventional | |
| Previous Owner | $300,000 | Adjustable Rate Mortgage/ARM | |
| Previous Owner | $304,000 | Purchase Money Mortgage | |
| Previous Owner | $139,000 | Purchase Money Mortgage | |
| Previous Owner | $109,250 | Purchase Money Mortgage |
Source: Public Records
Property History
| Date | Event | Price | Change | Sq Ft Price |
|---|---|---|---|---|
| 06/28/2021 06/28/21 | Rented | $2,600 | +4.0% | -- |
| 06/14/2021 06/14/21 | Under Contract | -- | -- | -- |
| 06/09/2021 06/09/21 | For Rent | $2,500 | 0.0% | -- |
| 02/25/2021 02/25/21 | Off Market | $2,500 | -- | -- |
| 02/17/2021 02/17/21 | For Rent | $2,500 | -16.7% | -- |
| 08/08/2019 08/08/19 | Rented | $3,000 | -99.5% | -- |
| 08/07/2019 08/07/19 | Under Contract | -- | -- | -- |
| 07/30/2019 07/30/19 | Sold | $555,000 | 0.0% | $624 / Sq Ft |
| 07/16/2019 07/16/19 | For Rent | $3,000 | 0.0% | -- |
| 06/26/2019 06/26/19 | Pending | -- | -- | -- |
| 06/05/2019 06/05/19 | For Sale | $575,000 | 0.0% | $646 / Sq Ft |
| 05/21/2018 05/21/18 | Rented | $2,800 | 0.0% | -- |
| 05/16/2018 05/16/18 | Under Contract | -- | -- | -- |
| 05/08/2018 05/08/18 | For Rent | $2,800 | 0.0% | -- |
| 07/15/2016 07/15/16 | Sold | $485,000 | -1.0% | $545 / Sq Ft |
| 05/11/2016 05/11/16 | Pending | -- | -- | -- |
| 04/20/2016 04/20/16 | For Sale | $490,000 | +25.0% | $551 / Sq Ft |
| 09/06/2013 09/06/13 | Sold | $392,000 | +1.8% | $440 / Sq Ft |
| 07/17/2013 07/17/13 | Pending | -- | -- | -- |
| 07/11/2013 07/11/13 | For Sale | $385,000 | -- | $433 / Sq Ft |
Source: MLS Property Information Network (MLS PIN)
Tax History Compared to Growth
Tax History
| Year | Tax Paid | Tax Assessment Tax Assessment Total Assessment is a certain percentage of the fair market value that is determined by local assessors to be the total taxable value of land and additions on the property. | Land | Improvement |
|---|---|---|---|---|
| 2025 | $5,937 | $512,700 | $0 | $512,700 |
| 2024 | $5,964 | $547,200 | $0 | $547,200 |
| 2023 | $5,702 | $530,900 | $0 | $530,900 |
| 2022 | $5,554 | $510,500 | $0 | $510,500 |
| 2021 | $5,447 | $510,500 | $0 | $510,500 |
| 2020 | $4,808 | $455,300 | $0 | $455,300 |
| 2019 | $4,285 | $406,500 | $0 | $406,500 |
| 2018 | $4,056 | $387,000 | $0 | $387,000 |
| 2017 | $3,942 | $372,200 | $0 | $372,200 |
| 2016 | $3,974 | $361,300 | $0 | $361,300 |
| 2015 | $4,182 | $345,300 | $0 | $345,300 |
| 2014 | $4,042 | $321,300 | $0 | $321,300 |
Source: Public Records
Agents Affiliated with this Home
-
Lesley Smith
Seller's Agent in 2021
Lesley Smith
Barrett Sotheby's International Realty
(781) 405-2991
4 in this area
61 Total Sales
-
Michael Foxx
Buyer's Agent in 2021
Michael Foxx
Amo Realty - Boston City Properties
(617) 462-4283
43 Total Sales
-
Martha Toti
Seller's Agent in 2019
Martha Toti
Coldwell Banker Realty - Boston
(617) 337-4201
27 in this area
156 Total Sales
-
Amanda Werner
A
Seller Co-Listing Agent in 2019
Amanda Werner
Coldwell Banker Realty - Boston
14 in this area
65 Total Sales
-
K
Buyer's Agent in 2019
Kirby Taylor Team
Fortune RE
-
Collin Bray
Seller's Agent in 2016
Collin Bray
Century 21 Cityside
(617) 512-1095
2 in this area
168 Total Sales
Map
Source: MLS Property Information Network (MLS PIN)
MLS Number: 71553659
APN: CHAR-000000-000002-000905-000008
Disclaimer: Certain information contained herein is derived from information provided by parties other than Homes.com. All information provided is deemed reliable, but is not guaranteed to be accurate and should be independently verified.
![]() The property listing data and information, or the Images, set forth herein were provided to MLS Property Information Network, Inc. from third party sources, including sellers, lessors and public records, and were compiled by MLS Property Information Network, Inc. The property listing data and information, and the Images, are for the personal, non-commercial use of consumers having a good faith interest in purchasing or leasing listed properties of the type displayed to them and may not be used for any purpose other than to identify prospective properties which such consumers may have a good faith interest in purchasing or leasing. MLS Property Information Network, Inc. and its subscribers disclaim any and all representations and warranties as to the accuracy of the property listing data and information, or as to the accuracy of any of the Images, set forth herein.
The property listing data and information, or the Images, set forth herein were provided to MLS Property Information Network, Inc. from third party sources, including sellers, lessors and public records, and were compiled by MLS Property Information Network, Inc. The property listing data and information, and the Images, are for the personal, non-commercial use of consumers having a good faith interest in purchasing or leasing listed properties of the type displayed to them and may not be used for any purpose other than to identify prospective properties which such consumers may have a good faith interest in purchasing or leasing. MLS Property Information Network, Inc. and its subscribers disclaim any and all representations and warranties as to the accuracy of the property listing data and information, or as to the accuracy of any of the Images, set forth herein.
Nearby Homes
- 39 Sullivan St Unit 3
- 9 Russell St Unit 1
- 9 Russell St Unit 2
- 40 Pearl St Unit 1
- 21 Salem St Unit 1
- 247 Bunker Hill St Unit D
- 7 Cook St Unit 2
- 64 Walker St Unit 66
- 226 Bunker Hill St
- 298 Bunker Hill St Unit 1
- 285 Bunker Hill St Unit 2
- 5R Salem St
- 8 Mystic St Unit 1
- 15 Allston St Unit 2
- 20 Allston St Unit 2
- 67 Pearl St Unit 1
- 4 Lincoln Place Unit 4
- 66 High St Unit 2
- 6 Mystic Place
- 30 Green St