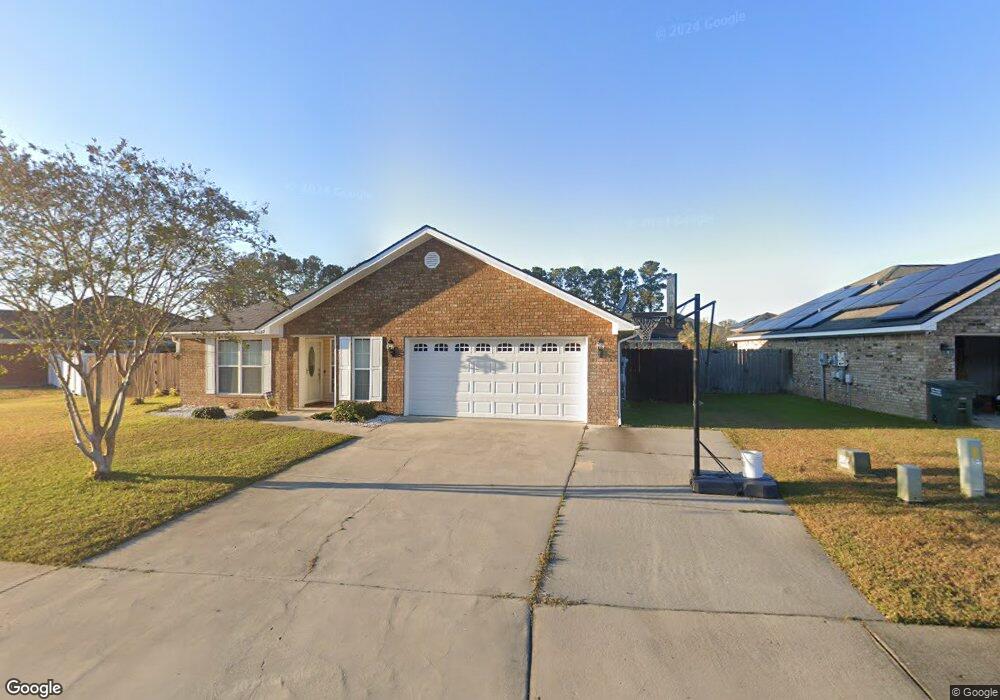
52 Sycamore Way Unit n/a Midway, GA 31320
Estimated Value: $279,051 - $289,000
3
Beds
2
Baths
1,469
Sq Ft
$193/Sq Ft
Est. Value
About This Home
This home is located at 52 Sycamore Way Unit n/a, Midway, GA 31320 and is currently estimated at $283,263, approximately $192 per square foot. 52 Sycamore Way Unit n/a is a home located in Liberty County with nearby schools including Liberty Elementary School, Midway Middle School, and Liberty County High School.
Ownership History
Date
Name
Owned For
Owner Type
Purchase Details
Closed on
Jun 16, 2025
Sold by
Rebers Randy R
Bought by
Beneus Gael
Current Estimated Value
Home Financials for this Owner
Home Financials are based on the most recent Mortgage that was taken out on this home.
Original Mortgage
$291,127
Outstanding Balance
$290,380
Interest Rate
6.81%
Mortgage Type
VA
Estimated Equity
-$7,117
Purchase Details
Closed on
Oct 21, 2022
Sold by
Thomas Charles K
Bought by
Rebers Randy Ronald and Rebers Susan Pearl
Home Financials for this Owner
Home Financials are based on the most recent Mortgage that was taken out on this home.
Original Mortgage
$150,000
Interest Rate
6.7%
Mortgage Type
New Conventional
Purchase Details
Closed on
Feb 13, 2018
Sold by
Thomas Charles K
Bought by
Thomas Charles K and Thomas Sheila M
Home Financials for this Owner
Home Financials are based on the most recent Mortgage that was taken out on this home.
Original Mortgage
$165,000
Interest Rate
4.04%
Mortgage Type
VA
Purchase Details
Closed on
Jan 31, 2011
Sold by
Dryden Enterprises Inc
Bought by
Thomas Charles K
Home Financials for this Owner
Home Financials are based on the most recent Mortgage that was taken out on this home.
Original Mortgage
$157,208
Interest Rate
4.82%
Mortgage Type
VA
Create a Home Valuation Report for This Property
The Home Valuation Report is an in-depth analysis detailing your home's value as well as a comparison with similar homes in the area
Home Values in the Area
Average Home Value in this Area
Purchase History
| Date | Buyer | Sale Price | Title Company |
|---|---|---|---|
| Beneus Gael | $285,000 | -- | |
| Rebers Randy Ronald | $260,000 | -- | |
| Thomas Charles K | -- | -- | |
| Thomas Charles K | $153,900 | -- |
Source: Public Records
Mortgage History
| Date | Status | Borrower | Loan Amount |
|---|---|---|---|
| Open | Beneus Gael | $291,127 | |
| Previous Owner | Rebers Randy Ronald | $150,000 | |
| Previous Owner | Thomas Charles K | $165,000 | |
| Previous Owner | Thomas Charles K | $157,208 |
Source: Public Records
Tax History Compared to Growth
Tax History
| Year | Tax Paid | Tax Assessment Tax Assessment Total Assessment is a certain percentage of the fair market value that is determined by local assessors to be the total taxable value of land and additions on the property. | Land | Improvement |
|---|---|---|---|---|
| 2024 | $4,330 | $100,697 | $20,000 | $80,697 |
| 2023 | $4,330 | $83,926 | $16,000 | $67,926 |
| 2022 | $174 | $65,443 | $16,000 | $49,443 |
| 2021 | $174 | $58,327 | $16,000 | $42,327 |
| 2020 | $164 | $54,745 | $14,000 | $40,745 |
| 2019 | $164 | $55,178 | $14,000 | $41,178 |
| 2018 | $164 | $55,612 | $14,000 | $41,612 |
| 2017 | $1,707 | $51,841 | $14,000 | $37,841 |
| 2016 | $164 | $52,231 | $14,000 | $38,231 |
| 2015 | $1,713 | $52,231 | $14,000 | $38,231 |
| 2014 | $1,713 | $58,660 | $14,000 | $44,660 |
| 2013 | -- | $54,800 | $14,000 | $40,800 |
Source: Public Records
Map
Nearby Homes
- 132 Caraway Ct
- 23 Sycamore Way
- 44 Caraway Ct
- 99 Caraway Ct
- 11 Kinlock Ct
- 42 Autumn Rift Rd
- 46 Outpost Trail
- 70 1st St
- 221 Outpost Trail
- 142 Oak Harvest Ridge
- 24 Jerico Marsh Lot 24 Rd
- 42 Greenwood
- 378 Myrtle Dr
- 18 Wild Heron Dr
- 169 Blue Jay Dr
- 0 Oak Ct
- 0 Oak Ct Unit 160688
- 4 2nd Ave
- 454 Jerico Dr
- 967 Lake Dr
- 32 Sycamore Way
- 68 Sycamore Way
- 173 Manchester Ct
- 193 Manchester Ct
- 151 Manchester Ct
- 207 Manchester Ct
- 49 Sycamore Way
- 35 Sycamore Way
- 75 Sycamore Way
- 61 Sycamore Way
- 0 Manchester Ct Unit 7293583
- 0 Manchester Ct Unit 8411638
- 221 Manchester Ct
- 98 Sycamore Way Unit n/a
- 98 Sycamore Way
- 87 Sycamore Way
- 13 Sycamore Way
- 1 Sycamore Way
- 198 Manchester Ct
- 164 Manchester Ct Unit n/a