Estimated Value: $307,000 - $436,000
3
Beds
2
Baths
1,404
Sq Ft
$259/Sq Ft
Est. Value
About This Home
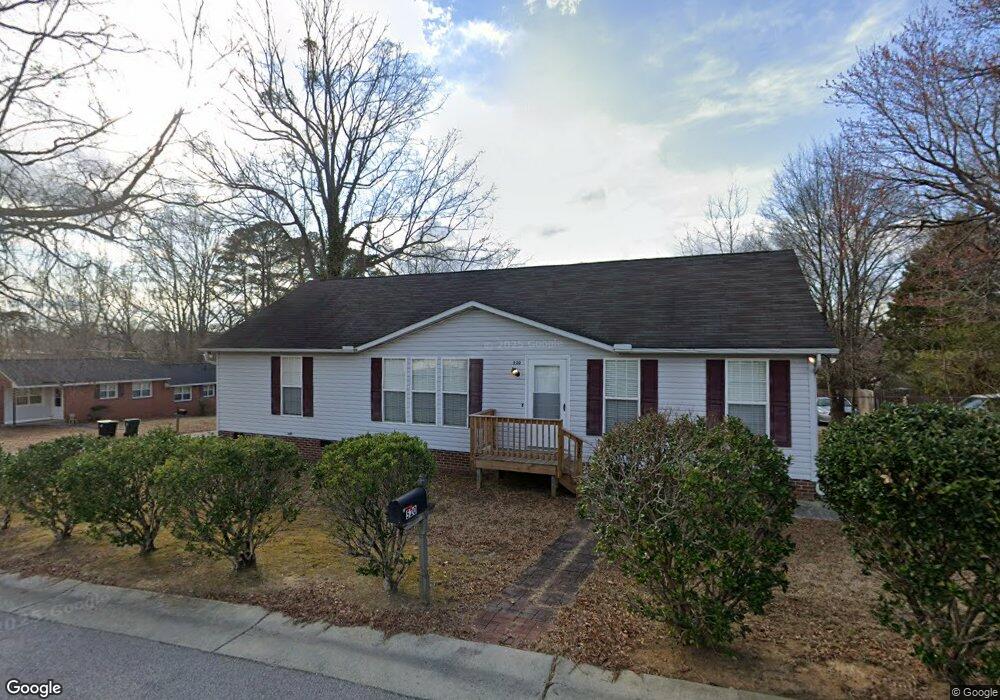
This home is located at 520 1st St, Apex, NC 27502 and is currently estimated at $363,333, approximately $258 per square foot. 520 1st St is a home located in Wake County with nearby schools including Baucom Elementary School, Apex Middle, and Apex High School.
Ownership History
Date
Name
Owned For
Owner Type
Purchase Details
Closed on
Oct 14, 2024
Sold by
Quinones Sandra D and Heredia Reinaldo V
Bought by
Heredia Family Revocable Living Trust and Heredia
Current Estimated Value
Purchase Details
Closed on
Mar 25, 2004
Sold by
Quinones Sandra D
Bought by
Town Of Apex
Purchase Details
Closed on
Jun 22, 2000
Sold by
Kurst Donna Marie
Bought by
Quinones Sandra D
Home Financials for this Owner
Home Financials are based on the most recent Mortgage that was taken out on this home.
Original Mortgage
$12,738
Interest Rate
8.55%
Purchase Details
Closed on
Jan 21, 2000
Sold by
J & M Resources Partnership
Bought by
Kurst Donna Marie
Purchase Details
Closed on
May 19, 1999
Sold by
Calmco Servicing Lp
Bought by
J & M Resources
Purchase Details
Closed on
Aug 31, 1998
Sold by
Faulk Joe Avery
Bought by
Dlj Mtg Acceptance Corp
Create a Home Valuation Report for This Property
The Home Valuation Report is an in-depth analysis detailing your home's value as well as a comparison with similar homes in the area
Purchase History
| Date | Buyer | Sale Price | Title Company |
|---|---|---|---|
| Heredia Family Revocable Living Trust | -- | None Listed On Document | |
| Town Of Apex | -- | -- | |
| Quinones Sandra D | $18,000 | -- | |
| Kurst Donna Marie | $16,500 | -- | |
| J & M Resources | $15,000 | -- | |
| Dlj Mtg Acceptance Corp | $23,092 | -- |
Source: Public Records
Mortgage History
| Date | Status | Borrower | Loan Amount |
|---|---|---|---|
| Previous Owner | Quinones Sandra D | $12,738 |
Source: Public Records
Tax History
| Year | Tax Paid | Tax Assessment Tax Assessment Total Assessment is a certain percentage of the fair market value that is determined by local assessors to be the total taxable value of land and additions on the property. | Land | Improvement |
|---|---|---|---|---|
| 2025 | $2,745 | $312,084 | $130,000 | $182,084 |
| 2024 | $2,684 | $312,084 | $130,000 | $182,084 |
Source: Public Records
Map
Nearby Homes
- 1434 Salem Creek Dr
- 203 Milky Way Dr
- 1614 Brussels Dr
- 111 Lemon Drop Cir
- 307 S Elm St
- 318 Glaston Ct
- 102 Licorice Dr
- 120 Licorice Dr
- 1750 Minley Way
- 101 Harbor Haven Dr
- 506 W Chatham St
- 1008 Daresbury Dr
- 1400 Applethorn Dr
- 901 Woodbriar St
- 105 Cunningham St
- 0-2932 Tingen Rd
- 309 Culvert St
- 311 Culvert St
- 314 Wrenn St
- 710 Mid Summer Ln
Your Personal Tour Guide
Ask me questions while you tour the home.