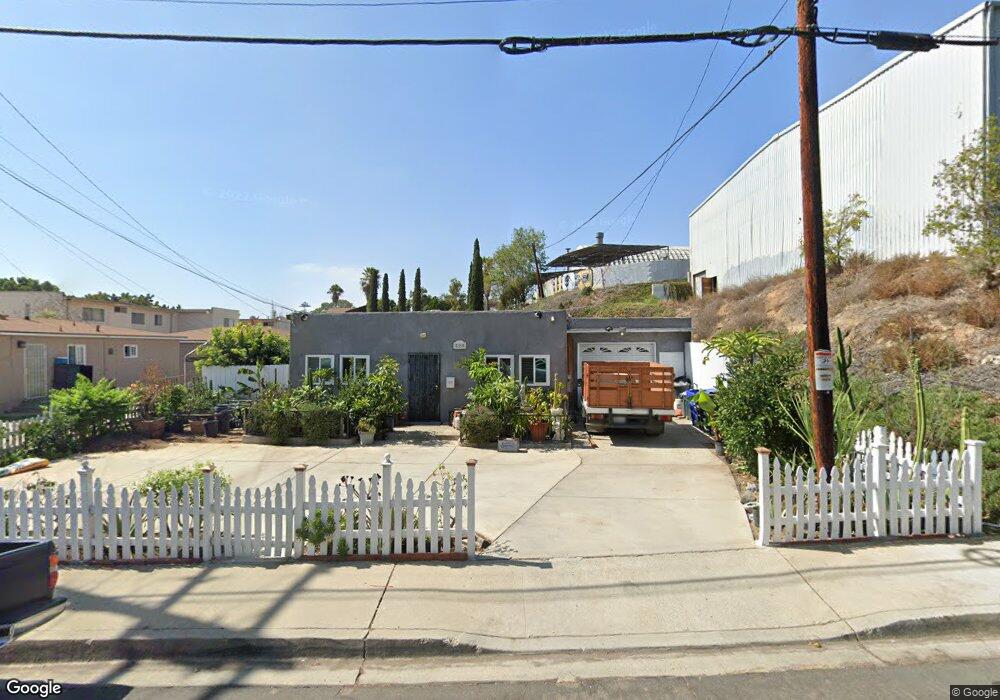
520 29th St San Diego, CA 92102
Grant Hill NeighborhoodEstimated Value: $774,000 - $846,000
5
Beds
1
Bath
1,400
Sq Ft
$580/Sq Ft
Est. Value
About This Home
This home is located at 520 29th St, San Diego, CA 92102 and is currently estimated at $812,274, approximately $580 per square foot. 520 29th St is a home located in San Diego County with nearby schools including Kimbrough Elementary School, Logan Memorial Educational Campus, and King-Chavez Primary Academy.
Ownership History
Date
Name
Owned For
Owner Type
Purchase Details
Closed on
Oct 6, 2003
Sold by
Chan Apolinaro
Bought by
Chan Apolinaro
Current Estimated Value
Home Financials for this Owner
Home Financials are based on the most recent Mortgage that was taken out on this home.
Original Mortgage
$206,250
Outstanding Balance
$80,624
Interest Rate
3.87%
Mortgage Type
Unknown
Estimated Equity
$731,650
Purchase Details
Closed on
Jul 19, 1999
Sold by
Pac Star Acquisitions & Development Inc
Bought by
Chan Apolinario
Home Financials for this Owner
Home Financials are based on the most recent Mortgage that was taken out on this home.
Original Mortgage
$119,700
Interest Rate
7.7%
Purchase Details
Closed on
Jun 11, 1998
Sold by
Hicks Family Trust 04-02-92
Bought by
Pac Star Acquisitions & Development Inc
Home Financials for this Owner
Home Financials are based on the most recent Mortgage that was taken out on this home.
Original Mortgage
$67,500
Interest Rate
7.06%
Mortgage Type
Stand Alone First
Purchase Details
Closed on
Jun 5, 1985
Create a Home Valuation Report for This Property
The Home Valuation Report is an in-depth analysis detailing your home's value as well as a comparison with similar homes in the area
Home Values in the Area
Average Home Value in this Area
Purchase History
| Date | Buyer | Sale Price | Title Company |
|---|---|---|---|
| Chan Apolinaro | -- | First American Title Co | |
| Chan Apolinario | $126,000 | Chicago Title Co | |
| Pac Star Acquisitions & Development Inc | $66,000 | Stewart Title Company | |
| -- | $48,000 | -- |
Source: Public Records
Mortgage History
| Date | Status | Borrower | Loan Amount |
|---|---|---|---|
| Open | Chan Apolinaro | $206,250 | |
| Closed | Chan Apolinario | $119,700 | |
| Previous Owner | Pac Star Acquisitions & Development Inc | $67,500 | |
| Closed | Pac Star Acquisitions & Development Inc | $20,000 |
Source: Public Records
Tax History Compared to Growth
Tax History
| Year | Tax Paid | Tax Assessment Tax Assessment Total Assessment is a certain percentage of the fair market value that is determined by local assessors to be the total taxable value of land and additions on the property. | Land | Improvement |
|---|---|---|---|---|
| 2025 | $2,028 | $172,652 | $53,780 | $118,872 |
| 2024 | $2,028 | $169,268 | $52,726 | $116,542 |
| 2023 | $2,228 | $186,113 | $51,693 | $134,420 |
| 2022 | $2,167 | $182,465 | $50,680 | $131,785 |
| 2021 | $2,151 | $178,888 | $49,687 | $129,201 |
| 2020 | $2,124 | $177,055 | $49,178 | $127,877 |
| 2019 | $2,085 | $173,584 | $48,214 | $125,370 |
| 2018 | $1,949 | $170,181 | $47,269 | $122,912 |
| 2017 | $80 | $166,845 | $46,343 | $120,502 |
| 2016 | $1,868 | $163,575 | $45,435 | $118,140 |
| 2015 | $1,840 | $161,119 | $44,753 | $116,366 |
| 2014 | $1,810 | $157,964 | $43,877 | $114,087 |
Source: Public Records
Map
Nearby Homes
- 0 J St Unit NDP2509260
- 2832 K St
- 3043 Market St
- 918-32 27th St
- 918-32 27th St Unit 918-32
- 2942 N L St
- 2863 Broadway Unit 105
- 2847 Broadway
- 2680 L St
- 3035 L St
- 2971/2971 1/2 Imperial Ave
- 3029 Broadway Unit 4
- 2950 Broadway Unit 16
- 2946 Commercial St
- 2701-11 Imperial Ave
- 2917 C St Unit 187
- 2930 Broadway Unit 55
- 244 26th St
- 2911 C St Unit 95
- 3078 Broadway Unit 216
- 512 29th St Unit 14
- 3 Island Ave
- 507 29th St
- 2850 Island Ave Unit 90
- 2912 Island Ave
- 510 Dodson St
- 2832 Island Ave
- 2830 Island Ave
- 2924 Island Ave Unit 26
- 2892 Market St
- 444 Hoitt St
- 2904 Market St
- 2904 Market St Unit 10
- 2904-10 Market St
- 28th Street
- 440 Hoitt St
- 2914 Market St Unit 18
- 525 28th St
- 525 - 575 28th St
- 525 28th St Unit 525535