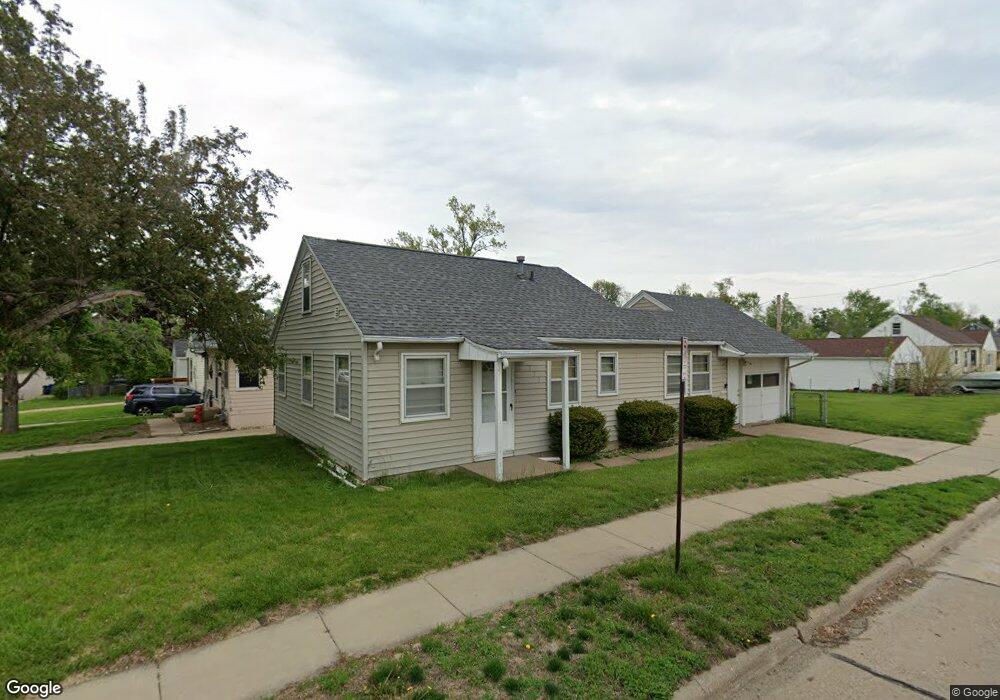
520 38th St NE Cedar Rapids, IA 52402
Kenwood Park NeighborhoodEstimated Value: $149,000 - $178,000
2
Beds
1
Bath
1,242
Sq Ft
$130/Sq Ft
Est. Value
About This Home
This home is located at 520 38th St NE, Cedar Rapids, IA 52402 and is currently estimated at $161,516, approximately $130 per square foot. 520 38th St NE is a home located in Linn County with nearby schools including Kenwood Leadership Academy, Franklin Middle School, and George Washington High School.
Ownership History
Date
Name
Owned For
Owner Type
Purchase Details
Closed on
Jul 30, 2008
Sold by
Dague John P and Dague John D
Bought by
Ebsen Anthony K and Ricketts Tracy E
Current Estimated Value
Home Financials for this Owner
Home Financials are based on the most recent Mortgage that was taken out on this home.
Original Mortgage
$93,532
Outstanding Balance
$61,898
Interest Rate
6.5%
Mortgage Type
FHA
Estimated Equity
$99,618
Purchase Details
Closed on
Sep 11, 2002
Sold by
Smith Timothy C
Bought by
Dague John P
Home Financials for this Owner
Home Financials are based on the most recent Mortgage that was taken out on this home.
Original Mortgage
$61,100
Interest Rate
6.54%
Mortgage Type
Balloon
Purchase Details
Closed on
Feb 27, 1998
Sold by
Kahler Phyllis Jean and Richmann Norman I
Bought by
Smith Timothy C
Home Financials for this Owner
Home Financials are based on the most recent Mortgage that was taken out on this home.
Original Mortgage
$69,825
Interest Rate
6.75%
Create a Home Valuation Report for This Property
The Home Valuation Report is an in-depth analysis detailing your home's value as well as a comparison with similar homes in the area
Home Values in the Area
Average Home Value in this Area
Purchase History
| Date | Buyer | Sale Price | Title Company |
|---|---|---|---|
| Ebsen Anthony K | $94,500 | None Available | |
| Dague John P | $76,000 | -- | |
| Smith Timothy C | $73,000 | -- |
Source: Public Records
Mortgage History
| Date | Status | Borrower | Loan Amount |
|---|---|---|---|
| Open | Ebsen Anthony K | $93,532 | |
| Previous Owner | Dague John P | $61,100 | |
| Previous Owner | Smith Timothy C | $69,825 |
Source: Public Records
Tax History Compared to Growth
Tax History
| Year | Tax Paid | Tax Assessment Tax Assessment Total Assessment is a certain percentage of the fair market value that is determined by local assessors to be the total taxable value of land and additions on the property. | Land | Improvement |
|---|---|---|---|---|
| 2025 | $2,220 | $140,600 | $25,300 | $115,300 |
| 2024 | $2,364 | $135,900 | $25,300 | $110,600 |
| 2023 | $2,364 | $135,900 | $25,300 | $110,600 |
| 2022 | $2,106 | $121,000 | $25,300 | $95,700 |
| 2021 | $2,136 | $110,600 | $20,200 | $90,400 |
| 2020 | $2,136 | $105,400 | $18,200 | $87,200 |
| 2019 | $1,920 | $97,600 | $16,200 | $81,400 |
| 2018 | $1,862 | $97,600 | $16,200 | $81,400 |
| 2017 | $1,856 | $93,700 | $16,200 | $77,500 |
| 2016 | $1,991 | $93,700 | $16,200 | $77,500 |
| 2015 | $1,959 | $92,045 | $16,160 | $75,885 |
| 2014 | $1,774 | $92,045 | $16,160 | $75,885 |
| 2013 | $1,732 | $92,045 | $16,160 | $75,885 |
Source: Public Records
Map
Nearby Homes
- 3817 Lennox Ave NE
- 3718 C Ave NE
- 143 40th St NE
- 727 37th St NE
- 3717 H Ave NE
- 615 34th St NE
- 413 34th St NE
- 3322 C Ave NE
- 628 33rd St NE
- 419 33rd St NE
- 410 32nd St NE
- 0 C Ave NE
- 1032 34th St NE
- 219 40th Street Dr SE Unit 206
- 4006 Westover Rd SE
- 3107 E Ave NE
- 139 32nd St NE
- 1114 35th St NE
- 232 31st St NE
- 1231 Miami Ct NE