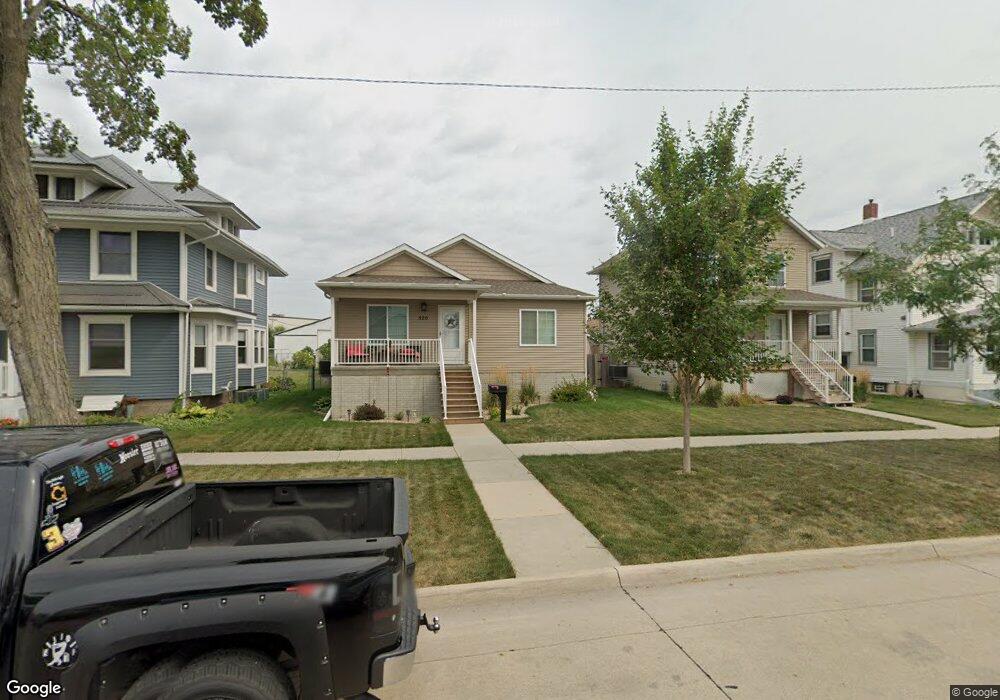
520 B Ave NW Cedar Rapids, IA 52405
Northwest Area NeighborhoodEstimated Value: $140,000 - $194,204
3
Beds
2
Baths
1,200
Sq Ft
$150/Sq Ft
Est. Value
About This Home
This home is located at 520 B Ave NW, Cedar Rapids, IA 52405 and is currently estimated at $179,801, approximately $149 per square foot. 520 B Ave NW is a home with nearby schools including Junction City Elementary School, Harrison Elementary School, and Kentucky Tech - Ashland Reg Tech Center.
Ownership History
Date
Name
Owned For
Owner Type
Purchase Details
Closed on
Apr 10, 2015
Sold by
Neighborhood Development Corp Of Cedar R
Bought by
Hogan Michael
Current Estimated Value
Home Financials for this Owner
Home Financials are based on the most recent Mortgage that was taken out on this home.
Original Mortgage
$110,625
Outstanding Balance
$85,254
Interest Rate
3.77%
Mortgage Type
New Conventional
Estimated Equity
$94,547
Create a Home Valuation Report for This Property
The Home Valuation Report is an in-depth analysis detailing your home's value as well as a comparison with similar homes in the area
Home Values in the Area
Average Home Value in this Area
Purchase History
| Date | Buyer | Sale Price | Title Company |
|---|---|---|---|
| Hogan Michael | $147,500 | None Available |
Source: Public Records
Mortgage History
| Date | Status | Borrower | Loan Amount |
|---|---|---|---|
| Open | Hogan Michael | $110,625 |
Source: Public Records
Tax History Compared to Growth
Tax History
| Year | Tax Paid | Tax Assessment Tax Assessment Total Assessment is a certain percentage of the fair market value that is determined by local assessors to be the total taxable value of land and additions on the property. | Land | Improvement |
|---|---|---|---|---|
| 2025 | $2,794 | $196,100 | $27,400 | $168,700 |
| 2024 | $3,480 | $177,800 | $27,400 | $150,400 |
| 2023 | $3,480 | $168,300 | $27,400 | $140,900 |
| 2022 | $3,102 | $173,900 | $25,100 | $148,800 |
| 2021 | $3,232 | $158,700 | $25,100 | $133,600 |
| 2020 | $3,232 | $155,100 | $20,600 | $134,500 |
| 2019 | $2,478 | $123,500 | $13,700 | $109,800 |
| 2018 | $2,406 | $123,500 | $13,700 | $109,800 |
| 2017 | $2,286 | $105,000 | $13,700 | $91,300 |
| 2016 | $852 | $40,100 | $13,700 | $26,400 |
| 2015 | -- | $0 | $0 | $0 |
Source: Public Records
Map
Nearby Homes