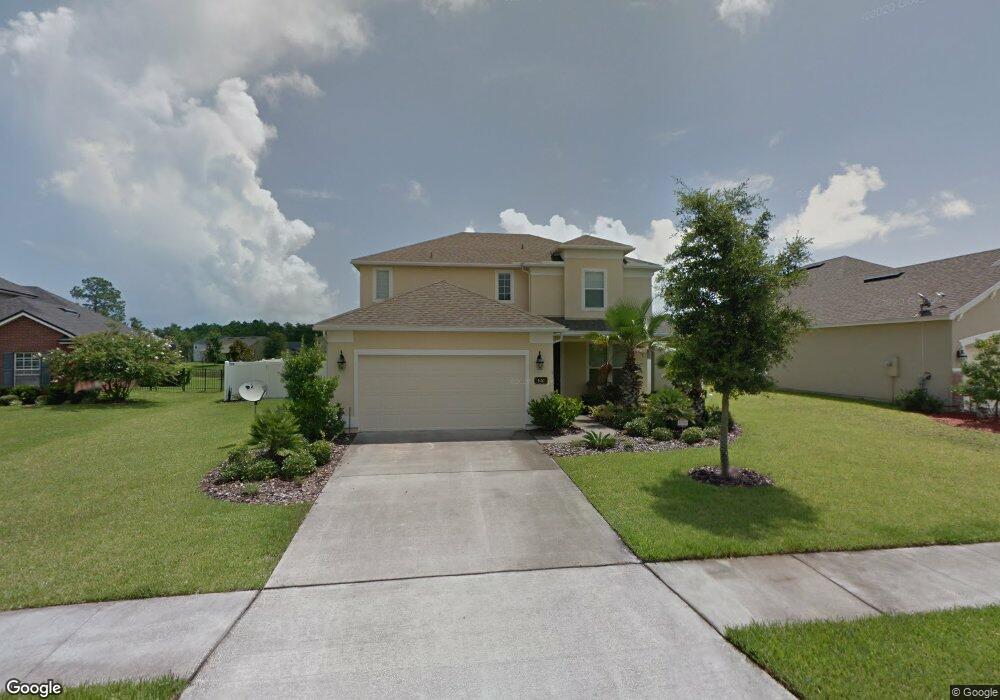
520 Cedar Arbor Ct Unit 41 Saint Augustine, FL 32084
North Augustine NeighborhoodEstimated Value: $465,573 - $542,000
4
Beds
3
Baths
2,215
Sq Ft
$224/Sq Ft
Est. Value
About This Home
This home is located at 520 Cedar Arbor Ct Unit 41, Saint Augustine, FL 32084 and is currently estimated at $495,893, approximately $223 per square foot. 520 Cedar Arbor Ct Unit 41 is a home located in St. Johns County with nearby schools including Crookshank Elementary School, Sebastian Middle School, and St. Augustine High School.
Ownership History
Date
Name
Owned For
Owner Type
Purchase Details
Closed on
Feb 7, 2025
Sold by
Wilson Janina and Wilson Harry Janina
Bought by
Wicklund James and Wicklund Jeannie
Current Estimated Value
Purchase Details
Closed on
May 22, 2020
Sold by
Rutledge Elvis S and Rutledge Jennifer C
Bought by
Wilson Janina
Home Financials for this Owner
Home Financials are based on the most recent Mortgage that was taken out on this home.
Original Mortgage
$319,014
Interest Rate
3.3%
Mortgage Type
FHA
Purchase Details
Closed on
Mar 19, 2010
Sold by
Lennar Homes Llc
Bought by
Rutledge Elvis S and Rutledge Jennifer C
Home Financials for this Owner
Home Financials are based on the most recent Mortgage that was taken out on this home.
Original Mortgage
$220,899
Interest Rate
5.5%
Mortgage Type
FHA
Create a Home Valuation Report for This Property
The Home Valuation Report is an in-depth analysis detailing your home's value as well as a comparison with similar homes in the area
Home Values in the Area
Average Home Value in this Area
Purchase History
| Date | Buyer | Sale Price | Title Company |
|---|---|---|---|
| Wicklund James | $490,000 | None Listed On Document | |
| Wicklund James | $490,000 | None Listed On Document | |
| Wilson Janina | $324,900 | Attorney | |
| Rutledge Elvis S | $225,000 | North American Title Company |
Source: Public Records
Mortgage History
| Date | Status | Borrower | Loan Amount |
|---|---|---|---|
| Previous Owner | Wilson Janina | $319,014 | |
| Previous Owner | Rutledge Elvis S | $220,899 |
Source: Public Records
Tax History
| Year | Tax Paid | Tax Assessment Tax Assessment Total Assessment is a certain percentage of the fair market value that is determined by local assessors to be the total taxable value of land and additions on the property. | Land | Improvement |
|---|---|---|---|---|
| 2025 | $6,211 | $390,498 | $85,000 | $305,498 |
| 2024 | $6,211 | $411,012 | $95,000 | $316,012 |
| 2023 | $6,211 | $402,901 | $105,000 | $297,901 |
| 2022 | $5,821 | $385,562 | $91,840 | $293,722 |
| 2021 | $5,055 | $265,110 | $0 | $0 |
| 2020 | $3,395 | $176,762 | $0 | $0 |
| 2019 | $3,426 | $172,788 | $0 | $0 |
| 2018 | $3,162 | $153,093 | $0 | $0 |
| 2017 | $3,152 | $149,944 | $0 | $0 |
| 2016 | $3,148 | $151,266 | $0 | $0 |
| 2015 | $3,175 | $150,214 | $0 | $0 |
| 2014 | $3,179 | $149,022 | $0 | $0 |
Source: Public Records
Map
Nearby Homes
- 712 Wooded Hamlet Ct
- 724 Wooded Hamlet Ct
- 325 Hefferon Dr
- 486 Hefferon Dr
- 2907 N 5th St
- 696 Oakland Ave
- 409 Pine Harvest Ct
- 1012 Arbor Trails Ct
- 466 Wooded Crossing Cir
- 2891 N 8th St
- 2861 N 7th St
- 2855 N 7th St
- 2898 N 10th St
- 2819 N 6th St
- 830 E Red House Branch Rd
- 94 Red House Cir
- 3516 Evernia St
- 2843 N 8th St
- 48 Red House Cir
- 576 Woodlawn Rd
- 520 Cedar Arbor Ct
- 516 Cedar Arbor Ct
- 516 Cedar Arbor Ct Unit 40
- 524 Cedar Arbor Ct
- 512 Cedar Arbor Ct Unit 39
- 512 Cedar Arbor Ct
- 517 Cedar Arbor Ct Unit 47
- 517 Cedar Arbor Ct
- 528 Cedar Arbor Ct
- 525 Cedar Arbor Ct
- 513 Cedar Arbor Ct
- 508 Cedar Arbor Ct Unit 38
- 508 Cedar Arbor Ct
- 529 Cedar Arbor Ct
- 509 Cedar Arbor Ct Unit 49
- 509 Cedar Arbor Ct
- 504 Cedar Arbor Ct Unit 37
- 504 Cedar Arbor Ct
- 505 Cedar Arbor Ct
- 715 Wooded Hamlet Ct
Your Personal Tour Guide
Ask me questions while you tour the home.