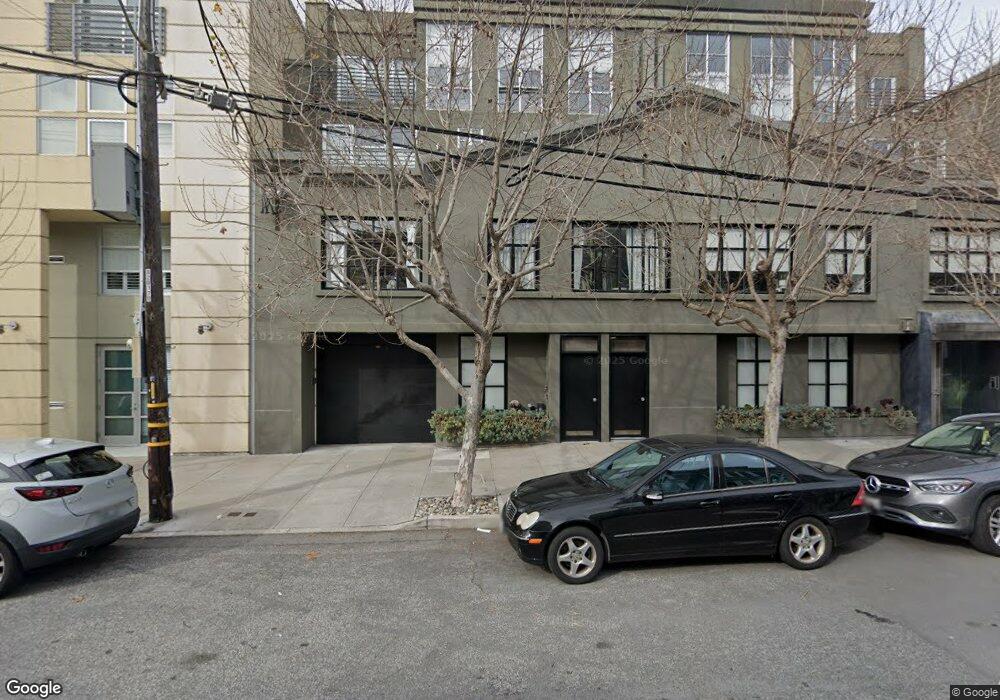
520 Chestnut St Unit 404 San Francisco, CA 94133
North Beach NeighborhoodEstimated Value: $928,600 - $1,217,000
2
Beds
2
Baths
1,018
Sq Ft
$1,078/Sq Ft
Est. Value
About This Home
This home is located at 520 Chestnut St Unit 404, San Francisco, CA 94133 and is currently estimated at $1,097,650, approximately $1,078 per square foot. 520 Chestnut St Unit 404 is a home located in San Francisco County with nearby schools including Garfield Elementary School, Francisco Middle School, and Sts. Peter And Paul K-8.
Ownership History
Date
Name
Owned For
Owner Type
Purchase Details
Closed on
Jun 13, 2011
Sold by
Valla Antonio and Valla Antoinette M
Bought by
Valla Antonio and Valla Antoinette M
Current Estimated Value
Purchase Details
Closed on
Sep 10, 2010
Sold by
Fv I Inc
Bought by
Valla Antonio and Valla Antoinette M
Purchase Details
Closed on
Mar 30, 2010
Sold by
Afshar Ehsan
Bought by
Fv-1
Purchase Details
Closed on
Mar 30, 2007
Sold by
Tabrizi Farnaz T
Bought by
Afshar Ehsan
Home Financials for this Owner
Home Financials are based on the most recent Mortgage that was taken out on this home.
Original Mortgage
$723,200
Interest Rate
6.37%
Mortgage Type
Purchase Money Mortgage
Purchase Details
Closed on
Feb 9, 2007
Sold by
Osullivan Fergus
Bought by
Afshar Ehsan
Home Financials for this Owner
Home Financials are based on the most recent Mortgage that was taken out on this home.
Original Mortgage
$723,200
Interest Rate
6.37%
Mortgage Type
Purchase Money Mortgage
Create a Home Valuation Report for This Property
The Home Valuation Report is an in-depth analysis detailing your home's value as well as a comparison with similar homes in the area
Home Values in the Area
Average Home Value in this Area
Purchase History
| Date | Buyer | Sale Price | Title Company |
|---|---|---|---|
| Valla Antonio | -- | None Available | |
| Valla Antonio | $736,000 | Old Republic Title Company | |
| Fv-1 | $612,000 | Accommodation | |
| Afshar Ehsan | -- | Fidelity National Title Co | |
| Afshar Ehsan | $904,000 | Fidelity National Title Co |
Source: Public Records
Mortgage History
| Date | Status | Borrower | Loan Amount |
|---|---|---|---|
| Previous Owner | Afshar Ehsan | $723,200 |
Source: Public Records
Tax History Compared to Growth
Tax History
| Year | Tax Paid | Tax Assessment Tax Assessment Total Assessment is a certain percentage of the fair market value that is determined by local assessors to be the total taxable value of land and additions on the property. | Land | Improvement |
|---|---|---|---|---|
| 2025 | $11,576 | $942,936 | $471,468 | $471,468 |
| 2024 | $11,576 | $924,448 | $462,224 | $462,224 |
| 2023 | $11,402 | $906,322 | $453,161 | $453,161 |
| 2022 | $11,240 | $888,552 | $444,276 | $444,276 |
| 2021 | $11,039 | $871,130 | $435,565 | $435,565 |
| 2020 | $11,098 | $862,198 | $431,099 | $431,099 |
| 2019 | $10,720 | $845,294 | $422,647 | $422,647 |
| 2018 | $10,361 | $828,720 | $414,360 | $414,360 |
| 2017 | $9,941 | $812,472 | $406,236 | $406,236 |
| 2016 | $9,769 | $796,542 | $398,271 | $398,271 |
| 2015 | $9,648 | $784,578 | $392,289 | $392,289 |
| 2014 | $9,395 | $769,210 | $384,605 | $384,605 |
Source: Public Records
Map
Nearby Homes
- 411 Francisco St Unit 105
- 424 Francisco St
- 2011 Powell St
- 600 Chestnut St Unit 103
- 372 Francisco St Unit 372
- 329 Bay St Unit 305
- 400 Bay St
- 1857 Mason St
- 816 Union St
- 69 Telegraph Place
- 202 Union St
- 1725 Kearny St Unit 1
- 447 Greenwich St
- 813 Union St
- 439 Greenwich St Unit 9
- 941 Lombard St
- 2341 Leavenworth St
- 719 Green St
- 240 Lombard St Unit 727
- 240 Lombard St Unit 235
- 520 Chestnut St
- 520 Chestnut St Unit 103
- 520 Chestnut St Unit 206
- 520 Chestnut St Unit 204
- 520 Chestnut St Unit 202
- 520 Chestnut St Unit 201
- 520 Chestnut St Unit 405
- 520 Chestnut St Unit 403
- 520 Chestnut St Unit 402
- 520 Chestnut St Unit 304
- 520 Chestnut St Unit 303
- 520 Chestnut St Unit 302
- 520 Chestnut St Unit 205
- 520 Chestnut St Unit 203
- 520 Chestnut St Unit 104
- 520 Chestnut St Unit 102
- 520 Chestnut St Unit 101
- 520 Chestnut St Unit 406
- 520 Chestnut St Unit 401
- 2113 Powell St