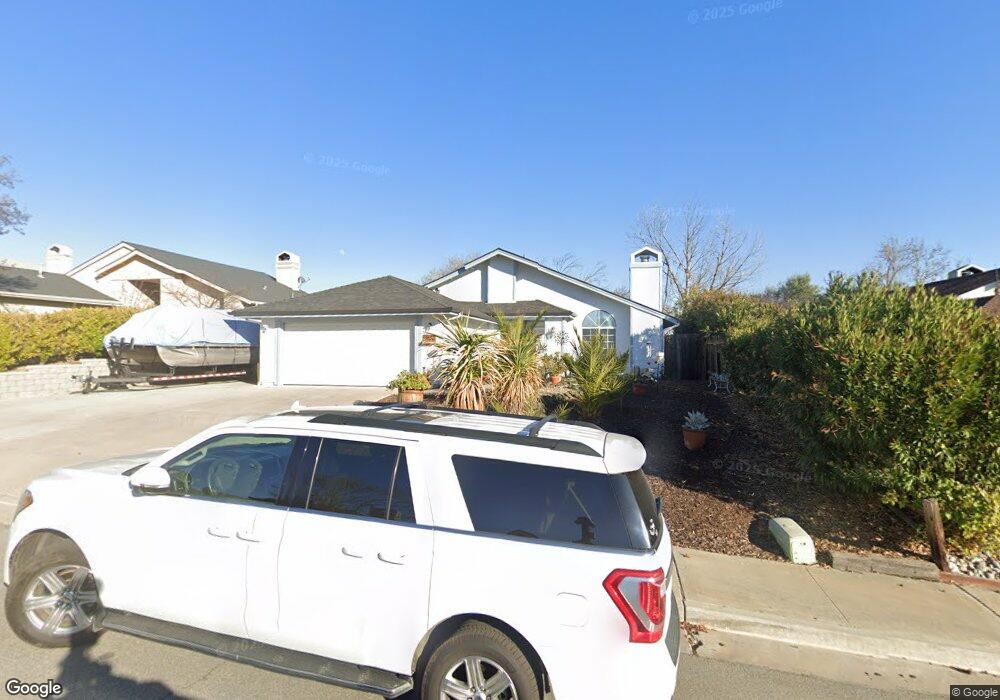
520 Chumash Ct Paso Robles, CA 93446
Estimated Value: $634,619 - $715,000
3
Beds
2
Baths
1,468
Sq Ft
$465/Sq Ft
Est. Value
About This Home
This home is located at 520 Chumash Ct, Paso Robles, CA 93446 and is currently estimated at $682,655, approximately $465 per square foot. 520 Chumash Ct is a home located in San Luis Obispo County with nearby schools including Winifred Pifer Elementary School, Daniel Lewis Middle School, and Paso Robles High School.
Ownership History
Date
Name
Owned For
Owner Type
Purchase Details
Closed on
Oct 22, 2014
Sold by
Orlando Robert Patrick and Orlando Robert P
Bought by
Orlando Robert P
Current Estimated Value
Purchase Details
Closed on
May 16, 2001
Sold by
Orlando Robert Patrick
Bought by
Orlando Robert P
Home Financials for this Owner
Home Financials are based on the most recent Mortgage that was taken out on this home.
Original Mortgage
$135,000
Interest Rate
7.15%
Purchase Details
Closed on
Aug 1, 2000
Sold by
Orlando Jana Sanders
Bought by
Orlando Robert Patrick
Create a Home Valuation Report for This Property
The Home Valuation Report is an in-depth analysis detailing your home's value as well as a comparison with similar homes in the area
Purchase History
| Date | Buyer | Sale Price | Title Company |
|---|---|---|---|
| Orlando Robert P | -- | None Available | |
| Orlando Robert P | -- | Fidelity National Title Co | |
| Orlando Robert Patrick | -- | -- |
Source: Public Records
Mortgage History
| Date | Status | Borrower | Loan Amount |
|---|---|---|---|
| Closed | Orlando Robert P | $135,000 |
Source: Public Records
Tax History
| Year | Tax Paid | Tax Assessment Tax Assessment Total Assessment is a certain percentage of the fair market value that is determined by local assessors to be the total taxable value of land and additions on the property. | Land | Improvement |
|---|---|---|---|---|
| 2025 | $3,230 | $303,524 | $137,961 | $165,563 |
| 2024 | $3,176 | $297,573 | $135,256 | $162,317 |
| 2023 | $3,176 | $291,739 | $132,604 | $159,135 |
| 2022 | $3,127 | $286,019 | $130,004 | $156,015 |
| 2021 | $3,073 | $280,411 | $127,455 | $152,956 |
| 2020 | $3,030 | $277,537 | $126,149 | $151,388 |
| 2019 | $2,985 | $272,096 | $123,676 | $148,420 |
| 2018 | $2,943 | $266,761 | $121,251 | $145,510 |
| 2017 | $2,766 | $261,531 | $118,874 | $142,657 |
| 2016 | $2,710 | $256,404 | $116,544 | $139,860 |
| 2015 | $2,699 | $252,554 | $114,794 | $137,760 |
| 2014 | $2,604 | $247,608 | $112,546 | $135,062 |
Source: Public Records
Map
Nearby Homes
- 448 Morgan Ln
- 827 Marlbank Place
- 845 Creston Rd
- 420 Creston Rd
- 715 Shannon Hill Dr
- 711 Knight Ct
- 1036 Samantha Dr
- 940 Austin Ct
- 1503 Las Brisas Dr
- 1020 Par Ave
- 616 Jackson Dr
- 1107 Patricia Ln
- 621 Jackson Dr
- 912 Wade Dr
- 1635 Wade Dr
- 828 Spring St
- 834 Nicklaus St
- 1006 Eagle Ct
- 13625 California 46
- 1736 Wade Dr
- 514 Chumash Ct
- 526 Chumash Ct
- 517 Sacagawea Ct
- 513 Sacagawea Ct
- 532 Chumash Ct
- 504 Chumash Ct
- 525 Sacagawea Ct
- 519 Chumash Ct
- 515 Chumash Ct
- 533 Sacagawea Ct
- 531 Chumash Ct
- 540 Chumash Ct
- 503 Chumash Ct
- 541 Sacagawea Ct
- 518 Navajo Ave
- 522 Sacagawea Ct
- 524 Navajo Ave
- 336 Crazy Horse Dr
- 516 Sacagawea Ct
- 548 Chumash Ct
Your Personal Tour Guide
Ask me questions while you tour the home.