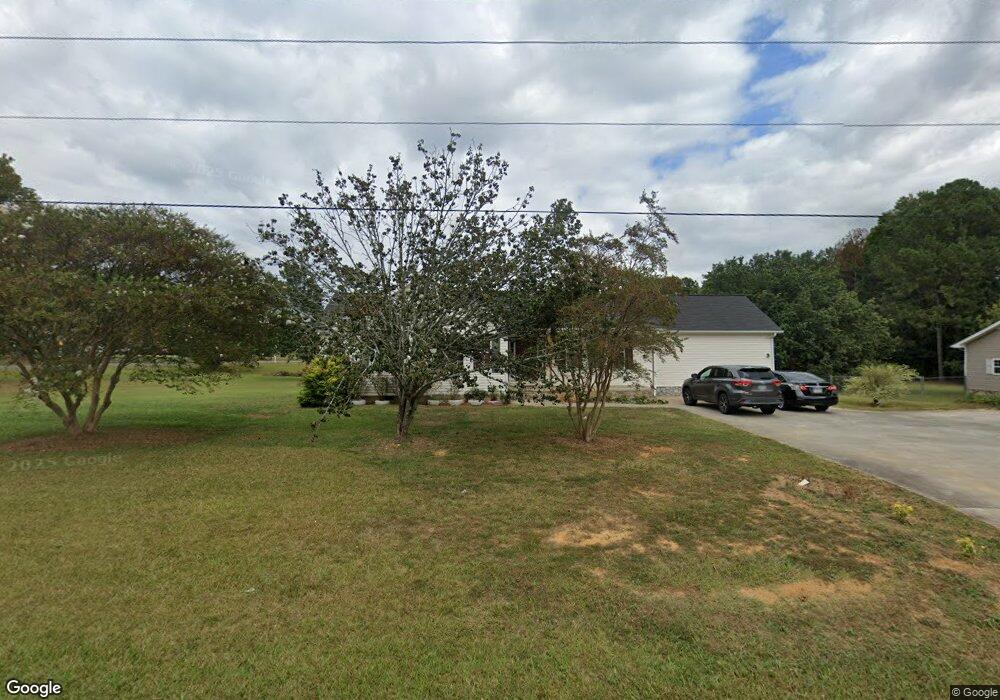
520 Cobb Rd Chatsworth, GA 30705
Estimated Value: $222,000 - $252,000
3
Beds
2
Baths
1,318
Sq Ft
$184/Sq Ft
Est. Value
About This Home
This home is located at 520 Cobb Rd, Chatsworth, GA 30705 and is currently estimated at $242,353, approximately $183 per square foot. 520 Cobb Rd is a home located in Murray County with nearby schools including Eton Elementary School, Bagley Middle School, and North Murray High School.
Ownership History
Date
Name
Owned For
Owner Type
Purchase Details
Closed on
Sep 11, 2020
Sold by
Galvez Justa
Bought by
Barrera Pedro H
Current Estimated Value
Home Financials for this Owner
Home Financials are based on the most recent Mortgage that was taken out on this home.
Original Mortgage
$50,350
Outstanding Balance
$44,682
Interest Rate
2.9%
Mortgage Type
New Conventional
Estimated Equity
$197,671
Purchase Details
Closed on
Jul 30, 2009
Sold by
Velasquez Idelfonzo
Bought by
Galvez Justa
Purchase Details
Closed on
Aug 22, 2003
Sold by
Gibson Mickey D
Bought by
Valasquez Idelfonzo
Purchase Details
Closed on
Jun 2, 1998
Sold by
Douhne Kamel Soloman
Bought by
Gibson Mickey D
Purchase Details
Closed on
Feb 19, 1997
Sold by
Weaver Charlie Ray
Bought by
Douhne Kamel Soloman
Purchase Details
Closed on
Sep 30, 1983
Bought by
Weaver Charlie Ray
Create a Home Valuation Report for This Property
The Home Valuation Report is an in-depth analysis detailing your home's value as well as a comparison with similar homes in the area
Home Values in the Area
Average Home Value in this Area
Purchase History
| Date | Buyer | Sale Price | Title Company |
|---|---|---|---|
| Barrera Pedro H | $53,000 | -- | |
| Galvez Justa | -- | -- | |
| Valasquez Idelfonzo | $114,000 | -- | |
| Gibson Mickey D | $93,500 | -- | |
| Douhne Kamel Soloman | $12,000 | -- | |
| Weaver Charlie Ray | -- | -- |
Source: Public Records
Mortgage History
| Date | Status | Borrower | Loan Amount |
|---|---|---|---|
| Open | Barrera Pedro H | $50,350 |
Source: Public Records
Tax History Compared to Growth
Tax History
| Year | Tax Paid | Tax Assessment Tax Assessment Total Assessment is a certain percentage of the fair market value that is determined by local assessors to be the total taxable value of land and additions on the property. | Land | Improvement |
|---|---|---|---|---|
| 2024 | $2,013 | $87,600 | $6,280 | $81,320 |
| 2023 | $2,008 | $85,720 | $6,280 | $79,440 |
| 2022 | $1,754 | $75,120 | $6,280 | $68,840 |
| 2021 | $1,520 | $61,800 | $6,280 | $55,520 |
| 2020 | $1,274 | $51,800 | $6,280 | $45,520 |
| 2019 | $1,228 | $49,720 | $6,280 | $43,440 |
| 2018 | $1,228 | $49,720 | $6,280 | $43,440 |
| 2017 | $0 | $46,480 | $6,280 | $40,200 |
| 2016 | $952 | $41,960 | $6,280 | $35,680 |
| 2015 | -- | $38,760 | $6,280 | $32,480 |
| 2014 | -- | $38,760 | $6,280 | $32,480 |
| 2013 | -- | $38,760 | $6,280 | $32,480 |
Source: Public Records
Map
Nearby Homes
- 11 Elbert St
- 156 Lyndsey Dr
- 181 Cobb Rd
- 250 Elbert St
- 75 Ellie Ln
- 118 Ellie Ln
- 100 Wildrose Dr
- 1800 Georgia 286
- 42 Evergreen Rd Unit LOT N
- 201 Coffey Rd
- 126 Strickland Dr
- 38 Earls Way
- 431 Mount Carmel Church Rd
- 0 Georgia 286
- 5710 Hwy 255n
- 216 Earls Way
- 401 Earls Way
- 214 Nassau Cir
- 255 Norton Bridge Rd
- 359 Norton Bridge Rd