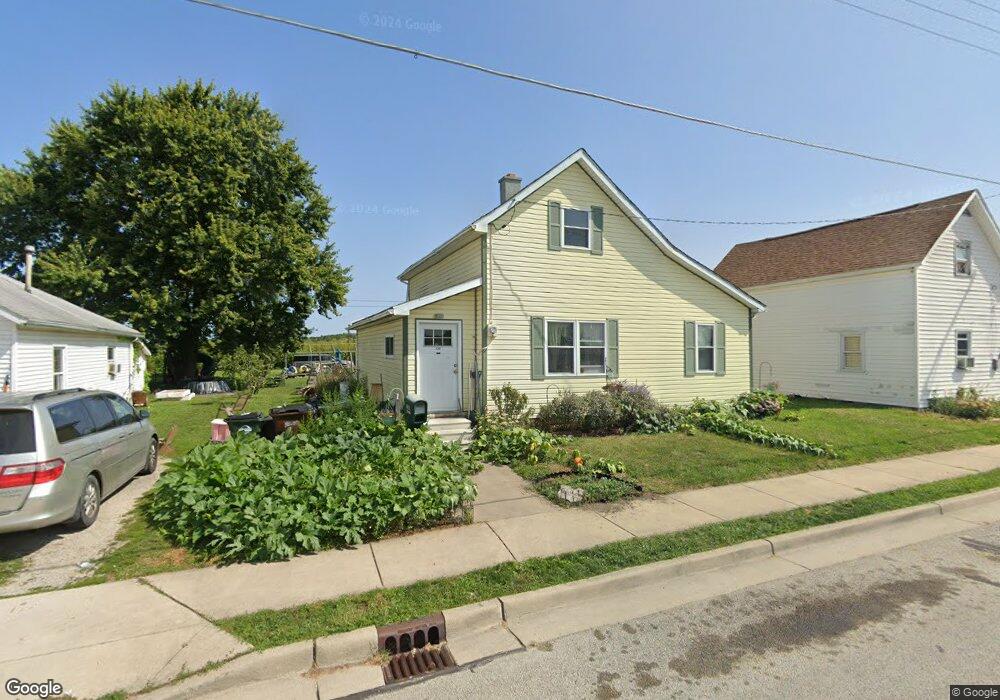
520 E Main St Bradford, OH 45308
Estimated Value: $102,000 - $124,000
3
Beds
1
Bath
1,279
Sq Ft
$86/Sq Ft
Est. Value
About This Home
This home is located at 520 E Main St, Bradford, OH 45308 and is currently estimated at $110,099, approximately $86 per square foot. 520 E Main St is a home located in Miami County with nearby schools including Bradford Elementary School and Bradford High School.
Ownership History
Date
Name
Owned For
Owner Type
Purchase Details
Closed on
Mar 24, 2009
Sold by
Second National Bank
Bought by
Mcgrath Timothy J and Mcgrath Johanna A
Current Estimated Value
Purchase Details
Closed on
May 9, 2008
Sold by
Richardson Hank and Richardson Linda L
Bought by
Second National Bank
Purchase Details
Closed on
Aug 6, 2004
Sold by
Bank Of New York
Bought by
Richardson Hank
Purchase Details
Closed on
Jul 29, 2004
Sold by
Cole Douglas G
Bought by
Bank Of New York
Purchase Details
Closed on
Mar 15, 2000
Sold by
Cole Willard H and Cole Betty L
Bought by
Cole Douglas Glenn
Purchase Details
Closed on
Jun 1, 1984
Bought by
Cole Willard H
Create a Home Valuation Report for This Property
The Home Valuation Report is an in-depth analysis detailing your home's value as well as a comparison with similar homes in the area
Purchase History
| Date | Buyer | Sale Price | Title Company |
|---|---|---|---|
| Mcgrath Timothy J | $30,000 | -- | |
| Second National Bank | -- | -- | |
| Richardson Hank | $20,000 | -- | |
| Bank Of New York | $18,000 | -- | |
| Cole Douglas Glenn | -- | -- | |
| Cole Willard H | $4,000 | -- |
Source: Public Records
Mortgage History
| Date | Status | Borrower | Loan Amount |
|---|---|---|---|
| Closed | Cole Douglas Glenn | $0 |
Source: Public Records
Tax History
| Year | Tax Paid | Tax Assessment Tax Assessment Total Assessment is a certain percentage of the fair market value that is determined by local assessors to be the total taxable value of land and additions on the property. | Land | Improvement |
|---|---|---|---|---|
| 2025 | $1,074 | $31,400 | $4,450 | $26,950 |
| 2024 | $1,074 | $18,450 | $4,830 | $13,620 |
| 2023 | $714 | $18,450 | $4,830 | $13,620 |
| 2022 | $736 | $18,450 | $4,830 | $13,620 |
| 2021 | $605 | $14,180 | $3,710 | $10,470 |
| 2020 | $603 | $14,180 | $3,710 | $10,470 |
| 2019 | $611 | $14,180 | $3,710 | $10,470 |
| 2018 | $586 | $13,410 | $3,990 | $9,420 |
| 2017 | $557 | $13,410 | $3,990 | $9,420 |
| 2016 | $548 | $13,410 | $3,990 | $9,420 |
| 2015 | $521 | $12,430 | $3,710 | $8,720 |
| 2014 | $521 | $12,430 | $3,710 | $8,720 |
| 2013 | $528 | $12,430 | $3,710 | $8,720 |
Source: Public Records
Map
Nearby Homes
Your Personal Tour Guide
Ask me questions while you tour the home.