M
Seller's Agent in 2015
Maija Glenovich
Muljat Group


Estimated Value: $1,574,551 - $1,760,000
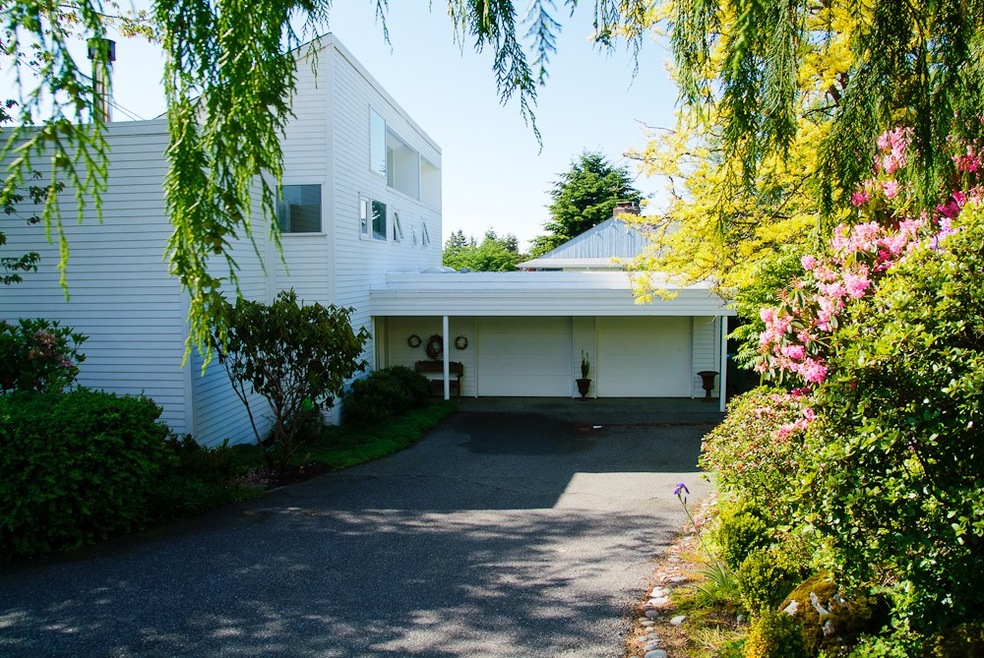
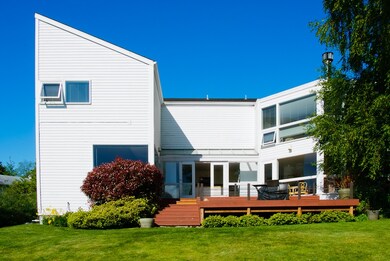
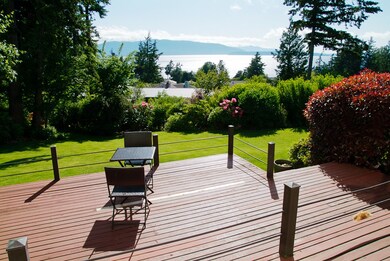
This uniquely designed timeless home is located within the desirable Edgemoor area, just minutes away from historic Fairhaven, shopping, restaurants, hotels, parks, trails, Amtrak, Greyhound, Alaskan Ferry and WWU. Light-filled home w/walls of windows offer bay, island and sunset views from most rooms. Loft-style master bedroom with en-suite, huge walk-in closet and office area, 2 guest bedrooms with lofts, 2 1/2 bathrooms, large 2-car garage and mature low-maintenance yard. One of a Kind!
Last Agent to Sell the Property
Maija Glenovich
Muljat Group License #115417 Listed on: 05/25/2014

Source: Northwest Multiple Listing Service (NWMLS)
MLS#: NWM640879
| Date | Buyer | Sale Price | Title Company |
|---|---|---|---|
| Orlowski Paul R | $708,125 | Chicago Title Insurance | |
| Kurtz Harvie Laura M | -- | Chicago Title Insurance |
| Date | Status | Borrower | Loan Amount |
|---|---|---|---|
| Open | Orlowski Paul R | $477,750 |
| Date | Event | Price | List to Sale | Price per Sq Ft |
|---|---|---|---|---|
| 02/23/2015 02/23/15 | Sold | $708,125 | -7.4% | $256 / Sq Ft |
| 01/22/2015 01/22/15 | Pending | -- | -- | -- |
| 11/06/2014 11/06/14 | For Sale | $765,000 | 0.0% | $276 / Sq Ft |
| 10/10/2014 10/10/14 | Pending | -- | -- | -- |
| 09/02/2014 09/02/14 | Price Changed | $765,000 | -3.0% | $276 / Sq Ft |
| 05/25/2014 05/25/14 | For Sale | $789,000 | -- | $285 / Sq Ft |
| Year | Tax Paid | Tax Assessment Tax Assessment Total Assessment is a certain percentage of the fair market value that is determined by local assessors to be the total taxable value of land and additions on the property. | Land | Improvement |
|---|---|---|---|---|
| 2024 | $11,073 | $1,500,721 | $802,465 | $698,256 |
| 2023 | $11,073 | $1,423,520 | $831,155 | $592,365 |
| 2022 | $9,120 | $1,211,513 | $707,370 | $504,143 |
| 2021 | $8,665 | $977,053 | $570,475 | $406,578 |
| 2020 | $8,514 | $857,058 | $500,413 | $356,645 |
| 2019 | $7,856 | $813,533 | $475,000 | $338,533 |
| 2018 | $8,124 | $752,784 | $423,150 | $329,634 |
| 2017 | $6,918 | $668,199 | $375,600 | $292,599 |
| 2016 | $6,297 | $593,960 | $345,600 | $248,360 |
| 2015 | $6,198 | $563,245 | $327,600 | $235,645 |
| 2014 | -- | $536,414 | $312,000 | $224,414 |
| 2013 | -- | $511,911 | $300,000 | $211,911 |
M
Seller's Agent in 2015
Maija Glenovich
Muljat Group
Buyer's Agent in 2015
Jon Rockwood
eXp Realty
(360) 815-5079
83 Total Sales
Source: Northwest Multiple Listing Service (NWMLS)
MLS Number: NWM640879
APN: 370211-510144-0000
Disclaimer: Certain information contained herein is derived from information provided by parties other than Homes.com. All information provided is deemed reliable, but is not guaranteed to be accurate and should be independently verified.
![]() All data is obtained from various sources and may not have been verified by broker or MLS GRID. Supplied Open House Information is subject to change without notice. All information should be independently reviewed and verified for accuracy. Properties may or may not be listed by the office/agent presenting the information. Listing information is provided by the Northwest Multiple Listing Service (NWMLS). Property information is based on available data that may include MLS information, county records, and other sources. Listings marked with the 3 tree icon and provided by NWMLS. All properties are subject to prior sale or withdrawal. IDX information is provided exclusively for consumers’ personal noncommercial use, that it may not be used for any purpose other than to identify prospective properties consumers may be interested in purchasing, that the data is deemed reliable but is not guaranteed by MLS GRID. ©2025 NWMLS.
All data is obtained from various sources and may not have been verified by broker or MLS GRID. Supplied Open House Information is subject to change without notice. All information should be independently reviewed and verified for accuracy. Properties may or may not be listed by the office/agent presenting the information. Listing information is provided by the Northwest Multiple Listing Service (NWMLS). Property information is based on available data that may include MLS information, county records, and other sources. Listings marked with the 3 tree icon and provided by NWMLS. All properties are subject to prior sale or withdrawal. IDX information is provided exclusively for consumers’ personal noncommercial use, that it may not be used for any purpose other than to identify prospective properties consumers may be interested in purchasing, that the data is deemed reliable but is not guaranteed by MLS GRID. ©2025 NWMLS.
Based on information submitted to the MLS GRID