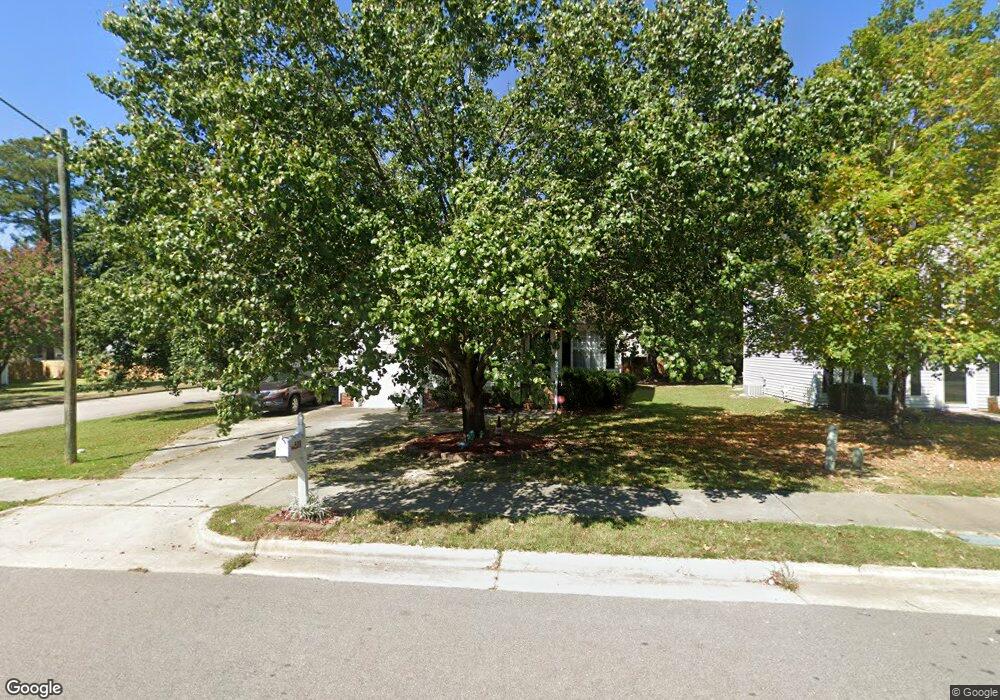
520 Laurens Way Knightdale, NC 27545
Estimated Value: $296,000 - $324,000
3
Beds
2
Baths
1,401
Sq Ft
$222/Sq Ft
Est. Value
About This Home
This home is located at 520 Laurens Way, Knightdale, NC 27545 and is currently estimated at $311,208, approximately $222 per square foot. 520 Laurens Way is a home located in Wake County with nearby schools including Lockhart Elementary School, Neuse River Middle School, and Knightdale High.
Ownership History
Date
Name
Owned For
Owner Type
Purchase Details
Closed on
Sep 6, 2011
Sold by
L&M Properties Inc
Bought by
Lemon Marilyn D
Current Estimated Value
Home Financials for this Owner
Home Financials are based on the most recent Mortgage that was taken out on this home.
Original Mortgage
$134,611
Outstanding Balance
$93,361
Interest Rate
4.53%
Mortgage Type
New Conventional
Estimated Equity
$217,847
Purchase Details
Closed on
May 23, 2011
Sold by
Secretary Of Housing & Urban Development
Bought by
L&M Properties Inc
Purchase Details
Closed on
Dec 22, 2010
Sold by
Nsiantuadi Ngonde and Sarah Bofenda
Bought by
Secretary Of Housing & Urban Development
Purchase Details
Closed on
Jul 5, 2001
Sold by
Anderson Homes Inc
Bought by
Nsiantuadi Ngonde and Sarah Bofenda
Home Financials for this Owner
Home Financials are based on the most recent Mortgage that was taken out on this home.
Original Mortgage
$129,878
Interest Rate
7.1%
Mortgage Type
FHA
Create a Home Valuation Report for This Property
The Home Valuation Report is an in-depth analysis detailing your home's value as well as a comparison with similar homes in the area
Home Values in the Area
Average Home Value in this Area
Purchase History
| Date | Buyer | Sale Price | Title Company |
|---|---|---|---|
| Lemon Marilyn D | $130,000 | None Available | |
| L&M Properties Inc | -- | None Available | |
| Secretary Of Housing & Urban Development | $124,508 | None Available | |
| Nsiantuadi Ngonde | $131,000 | -- |
Source: Public Records
Mortgage History
| Date | Status | Borrower | Loan Amount |
|---|---|---|---|
| Open | Lemon Marilyn D | $134,611 | |
| Previous Owner | Nsiantuadi Ngonde | $129,878 |
Source: Public Records
Tax History Compared to Growth
Tax History
| Year | Tax Paid | Tax Assessment Tax Assessment Total Assessment is a certain percentage of the fair market value that is determined by local assessors to be the total taxable value of land and additions on the property. | Land | Improvement |
|---|---|---|---|---|
| 2025 | $3,206 | $332,920 | $85,000 | $247,920 |
| 2024 | $3,194 | $332,920 | $85,000 | $247,920 |
| 2023 | $2,157 | $193,007 | $44,000 | $149,007 |
| 2022 | $2,084 | $193,007 | $44,000 | $149,007 |
| 2021 | $1,989 | $193,007 | $44,000 | $149,007 |
| 2020 | $1,989 | $193,007 | $44,000 | $149,007 |
| 2019 | $1,751 | $150,422 | $30,000 | $120,422 |
| 2018 | $1,651 | $150,422 | $30,000 | $120,422 |
| 2017 | $1,592 | $150,422 | $30,000 | $120,422 |
| 2016 | $1,570 | $150,422 | $30,000 | $120,422 |
| 2015 | $1,521 | $143,698 | $28,000 | $115,698 |
| 2014 | -- | $143,698 | $28,000 | $115,698 |
Source: Public Records
Map
Nearby Homes
- 506 Sternwheel Way
- 619 Laurens Way
- 444 Haywood Glen Dr
- 1580 Goldfinch Perch Ln
- 1444 Jay Rd
- 1728 Goldfinch Perch Ln
- 1440 Jay Rd
- 1704 Goldfinch Perch Ln
- 1442 Jay Rd
- 1712 Goldfinch Perch Ln
- 1448 Jay Rd
- 1504 Wader Cir
- 1512 Wader Cir
- 1516 Wader Cir
- 1500 Wader Cir
- 1732 Goldfinch Perch Ln
- 1508 Wader Cir
- 413 Laurens Way
- 702 Calavaras Ln
- 810 Steam Boat St
- 518 Laurens Way
- 417 Mingocrest Dr
- 516 Laurens Way
- 604 Laurens Way
- 418 Mingocrest Dr
- 521 Laurens Way
- 519 Laurens Way
- 416 Mingocrest Dr
- 103 Sulley Ct
- 514 Laurens Way
- 517 Laurens Way
- 413 Mingocrest Dr
- 414 Mingocrest Dr
- 606 Laurens Way
- 603 Laurens Way
- 515 Laurens Way
- 101 Sulley Ct
- 412 Mingocrest Dr
- 206 Tallula Ln
- 204 Tallula Ln