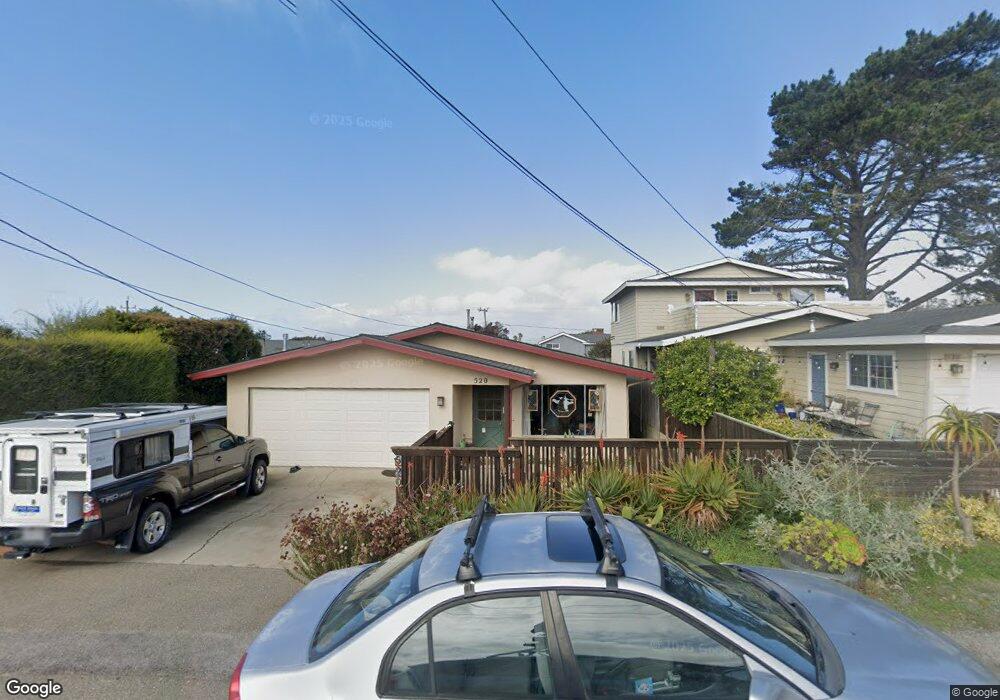
520 Loma St Los Osos, CA 93402
Estimated Value: $748,720 - $822,000
2
Beds
2
Baths
1,312
Sq Ft
$602/Sq Ft
Est. Value
About This Home
This home is located at 520 Loma St, Los Osos, CA 93402 and is currently estimated at $789,680, approximately $601 per square foot. 520 Loma St is a home located in San Luis Obispo County with nearby schools including Monarch Grove Elementary School, Los Osos Middle School, and Morro Bay High School.
Ownership History
Date
Name
Owned For
Owner Type
Purchase Details
Closed on
Aug 14, 2008
Sold by
Proctor Marilyn A and Lyle A Knudson Trust
Bought by
Stranlund Jeff
Current Estimated Value
Home Financials for this Owner
Home Financials are based on the most recent Mortgage that was taken out on this home.
Original Mortgage
$238,000
Interest Rate
6.5%
Mortgage Type
Purchase Money Mortgage
Purchase Details
Closed on
Apr 19, 1995
Sold by
Knudson Lyle A
Bought by
Knudson Lyle A
Create a Home Valuation Report for This Property
The Home Valuation Report is an in-depth analysis detailing your home's value as well as a comparison with similar homes in the area
Home Values in the Area
Average Home Value in this Area
Purchase History
| Date | Buyer | Sale Price | Title Company |
|---|---|---|---|
| Stranlund Jeff | $323,000 | First American Title Company | |
| Knudson Lyle A | -- | -- |
Source: Public Records
Mortgage History
| Date | Status | Borrower | Loan Amount |
|---|---|---|---|
| Previous Owner | Stranlund Jeff | $238,000 |
Source: Public Records
Tax History
| Year | Tax Paid | Tax Assessment Tax Assessment Total Assessment is a certain percentage of the fair market value that is determined by local assessors to be the total taxable value of land and additions on the property. | Land | Improvement |
|---|---|---|---|---|
| 2025 | $6,886 | $408,721 | $257,543 | $151,178 |
| 2024 | $6,769 | $400,708 | $252,494 | $148,214 |
| 2023 | $6,769 | $392,852 | $247,544 | $145,308 |
| 2022 | $6,511 | $385,150 | $242,691 | $142,459 |
| 2021 | $6,437 | $377,599 | $237,933 | $139,666 |
| 2020 | $6,149 | $373,728 | $235,494 | $138,234 |
| 2019 | $6,058 | $366,401 | $230,877 | $135,524 |
| 2018 | $6,007 | $359,217 | $226,350 | $132,867 |
| 2017 | $5,872 | $352,174 | $221,912 | $130,262 |
| 2016 | $4,674 | $345,269 | $217,561 | $127,708 |
| 2015 | $4,617 | $340,084 | $214,294 | $125,790 |
| 2014 | $4,313 | $333,423 | $210,097 | $123,326 |
Source: Public Records
Map
Nearby Homes