Estimated Value: $483,044 - $583,000
1
Bed
1
Bath
851
Sq Ft
$621/Sq Ft
Est. Value
About This Home
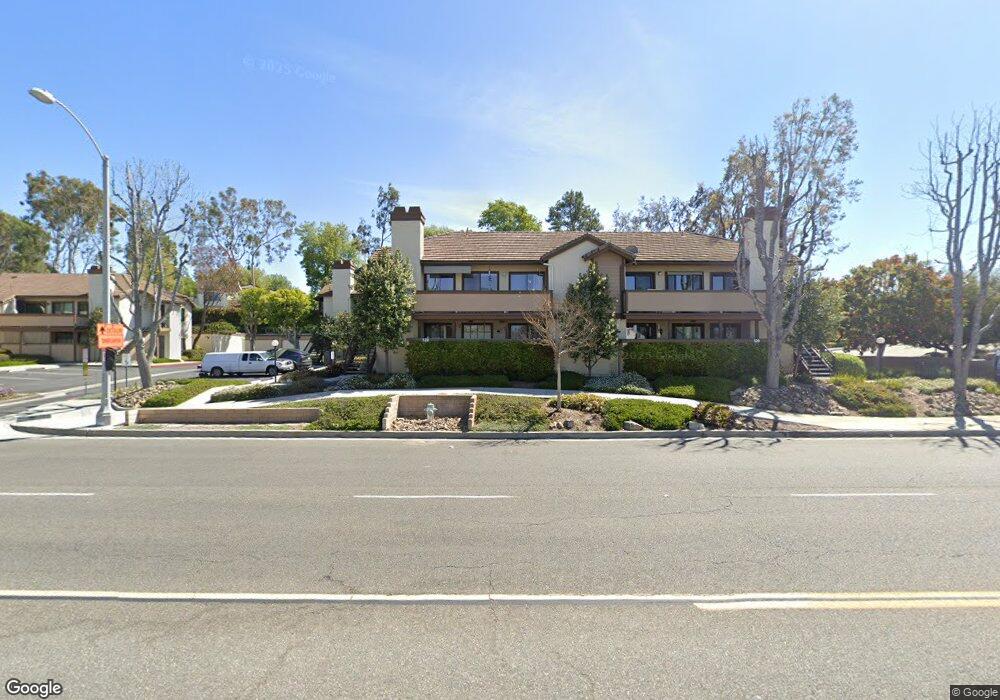
This home is located at 520 N Brea Blvd Unit 3, Brea, CA 92821 and is currently estimated at $528,261, approximately $620 per square foot. 520 N Brea Blvd Unit 3 is a home located in Orange County with nearby schools including William E. Fanning Elementary School, Brea Junior High School, and Brea-Olinda High School.
Ownership History
Date
Name
Owned For
Owner Type
Purchase Details
Closed on
Oct 6, 2004
Sold by
Ryan Denise M
Bought by
Ryan Denise M and The Denise M Ryan Revocable Trust
Current Estimated Value
Purchase Details
Closed on
Jul 22, 2003
Sold by
Santana Ricky Joseph and Santana Kimberly Diane
Bought by
Ryan Denise M
Home Financials for this Owner
Home Financials are based on the most recent Mortgage that was taken out on this home.
Original Mortgage
$175,200
Outstanding Balance
$76,392
Interest Rate
5.6%
Mortgage Type
Purchase Money Mortgage
Estimated Equity
$451,869
Purchase Details
Closed on
Apr 23, 2001
Sold by
Estate Of Brian Joseph Rapp
Bought by
Santana Ricky Joseph and Morey Kimberly Diane
Home Financials for this Owner
Home Financials are based on the most recent Mortgage that was taken out on this home.
Original Mortgage
$133,950
Interest Rate
6.89%
Purchase Details
Closed on
Nov 17, 1998
Sold by
Merrilee Snell
Bought by
Rapp Brian J
Home Financials for this Owner
Home Financials are based on the most recent Mortgage that was taken out on this home.
Original Mortgage
$96,000
Interest Rate
6.73%
Create a Home Valuation Report for This Property
The Home Valuation Report is an in-depth analysis detailing your home's value as well as a comparison with similar homes in the area
Home Values in the Area
Average Home Value in this Area
Purchase History
| Date | Buyer | Sale Price | Title Company |
|---|---|---|---|
| Ryan Denise M | -- | -- | |
| Ryan Denise M | $219,000 | North American Title Co | |
| Santana Ricky Joseph | $141,000 | Stewart Title | |
| Rapp Brian J | $96,000 | Lawyers Title Company |
Source: Public Records
Mortgage History
| Date | Status | Borrower | Loan Amount |
|---|---|---|---|
| Open | Ryan Denise M | $175,200 | |
| Previous Owner | Santana Ricky Joseph | $133,950 | |
| Previous Owner | Rapp Brian J | $96,000 |
Source: Public Records
Tax History
| Year | Tax Paid | Tax Assessment Tax Assessment Total Assessment is a certain percentage of the fair market value that is determined by local assessors to be the total taxable value of land and additions on the property. | Land | Improvement |
|---|---|---|---|---|
| 2025 | $3,656 | $311,361 | $207,255 | $104,106 |
| 2024 | $3,656 | $305,256 | $203,191 | $102,065 |
| 2023 | $3,553 | $299,271 | $199,207 | $100,064 |
| 2022 | $3,514 | $293,403 | $195,301 | $98,102 |
| 2021 | $3,448 | $287,650 | $191,471 | $96,179 |
| 2020 | $3,424 | $284,701 | $189,508 | $95,193 |
| 2019 | $3,335 | $279,119 | $185,792 | $93,327 |
| 2018 | $3,285 | $273,647 | $182,149 | $91,498 |
| 2017 | $3,223 | $268,282 | $178,578 | $89,704 |
| 2016 | $3,159 | $263,022 | $175,076 | $87,946 |
| 2015 | $3,114 | $259,072 | $172,447 | $86,625 |
| 2014 | $2,804 | $233,825 | $154,561 | $79,264 |
Source: Public Records
Map
Nearby Homes
- 600 Pepper Tree Dr
- 360 Meadow Ct
- 500 Silver Canyon Way
- 753 Site Dr
- 38 Rogers Ct
- 1002 Mariposa Dr
- 358 Trabuco Canyon Way
- 448 W Central Ave
- 648 Pepperwood Dr
- 310 Pineridge St
- 145 S Poplar Ave Unit 20
- 1252 Tamarack Ave
- 127 S Redwood Ave
- 856 Williams St
- 1051 Site Dr Unit 236
- 1051 Site Dr Unit 255
- 1051 Site Dr Unit 25
- 1051 Site Dr Unit 251
- 1445 Arrow Wood Dr
- 958 Baxter Pkwy
- 520 N Brea Blvd
- 520 N Brea Blvd Unit 6
- 520 N Brea Blvd Unit 7
- 520 N Brea Blvd Unit 9
- 520 N Brea Blvd Unit 5
- 520 N Brea Blvd Unit 10
- 520 N Brea Blvd Unit 8
- 520 N Brea Blvd Unit 4
- 520 N Brea Blvd Unit 1
- 520 N Brea Blvd Unit 2
- 540 N Brea Blvd Unit 12
- 540 N Brea Blvd Unit 16
- 540 N Brea Blvd Unit 11
- 540 N Brea Blvd Unit 15
- 540 N Brea Blvd Unit 18
- 540 N Brea Blvd Unit 19
- 540 N Brea Blvd Unit 20
- 540 N Brea Blvd Unit 17
- 540 N Brea Blvd Unit 14
- 540 N Brea Blvd
Your Personal Tour Guide
Ask me questions while you tour the home.