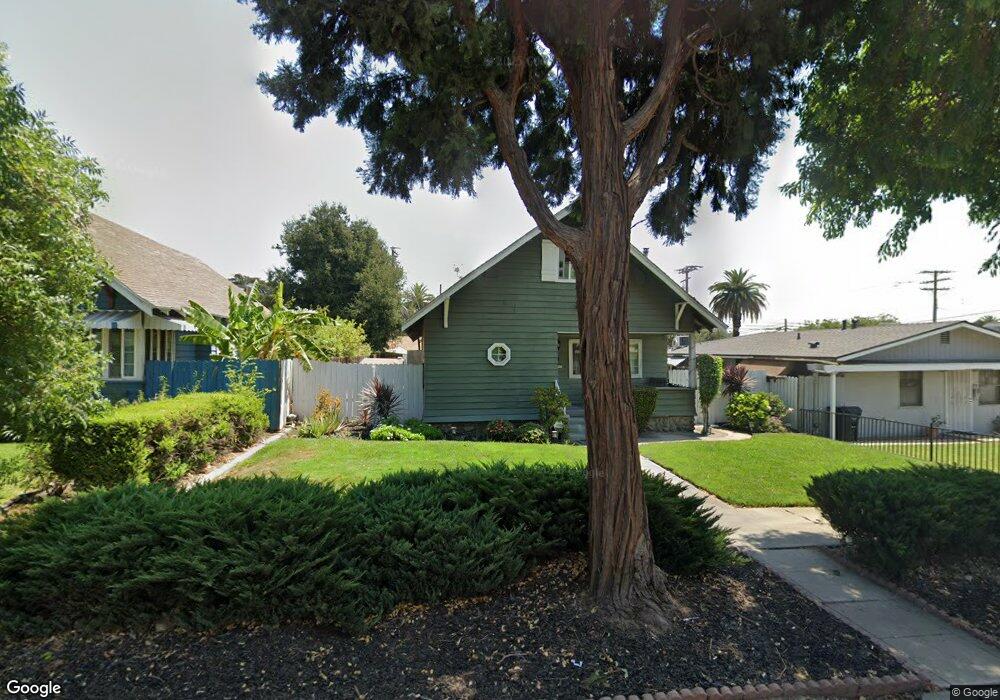
520 N Campus Ave Upland, CA 91786
Estimated Value: $662,990 - $747,000
4
Beds
3
Baths
1,786
Sq Ft
$397/Sq Ft
Est. Value
About This Home
This home is located at 520 N Campus Ave, Upland, CA 91786 and is currently estimated at $709,748, approximately $397 per square foot. 520 N Campus Ave is a home located in San Bernardino County with nearby schools including Upland Elementary School, Upland Junior High School, and Upland High School.
Ownership History
Date
Name
Owned For
Owner Type
Purchase Details
Closed on
Oct 12, 1998
Sold by
Green Raymond A and Green Helen M
Bought by
Wright Darrin M and Wright Elizabeth
Current Estimated Value
Home Financials for this Owner
Home Financials are based on the most recent Mortgage that was taken out on this home.
Original Mortgage
$141,780
Interest Rate
6.63%
Mortgage Type
FHA
Create a Home Valuation Report for This Property
The Home Valuation Report is an in-depth analysis detailing your home's value as well as a comparison with similar homes in the area
Home Values in the Area
Average Home Value in this Area
Purchase History
| Date | Buyer | Sale Price | Title Company |
|---|---|---|---|
| Wright Darrin M | $130,000 | Northern Counties Title |
Source: Public Records
Mortgage History
| Date | Status | Borrower | Loan Amount |
|---|---|---|---|
| Previous Owner | Wright Darrin M | $141,780 |
Source: Public Records
Tax History Compared to Growth
Tax History
| Year | Tax Paid | Tax Assessment Tax Assessment Total Assessment is a certain percentage of the fair market value that is determined by local assessors to be the total taxable value of land and additions on the property. | Land | Improvement |
|---|---|---|---|---|
| 2025 | $2,454 | $224,101 | $70,545 | $153,556 |
| 2024 | $2,454 | $219,707 | $69,162 | $150,545 |
| 2023 | $2,415 | $215,399 | $67,806 | $147,593 |
| 2022 | $2,361 | $211,175 | $66,476 | $144,699 |
| 2021 | $2,353 | $207,035 | $65,173 | $141,862 |
| 2020 | $2,289 | $204,912 | $64,505 | $140,407 |
| 2019 | $2,280 | $200,894 | $63,240 | $137,654 |
| 2018 | $2,226 | $196,955 | $62,000 | $134,955 |
| 2017 | $2,160 | $193,093 | $60,784 | $132,309 |
| 2016 | $1,974 | $189,307 | $59,592 | $129,715 |
| 2015 | $1,929 | $186,464 | $58,697 | $127,767 |
| 2014 | $1,878 | $182,811 | $57,547 | $125,264 |
Source: Public Records
Map
Nearby Homes
- 645 N 8th Ave
- 609 N 6th Ave
- 524 E Arrow Hwy
- 556 D St
- 511 D St
- 313 N 8th Ave
- 506 E 11th St
- 279 N 11th Ave
- 691 N 3rd Ave
- 389 N 3rd Ave
- 922 N 4th Ave
- 562 N 1st Ave
- 144 Royal Way
- 384 Ruby Red Ln
- 147 Royal Way
- 580 Katy Dr
- 1320 San Bernardino Rd Unit 34
- 144 Dorsett Ave
- 152 Dorsett Ave
- 1431 Prairie Rose Ln
- 520 N Ave
- 526 N Campus Ave
- 504 N Campus Ave
- 534 N Campus Ave
- 741 E Arrow Hwy
- 546 N Campus Ave
- 687 E Arrow Hwy
- 519 N 8th Ave
- 494 N Campus Ave
- 527 N 8th Ave
- 513 N 8th Ave
- 529 N Campus Ave
- 554 N Campus Ave
- 535 N 8th Ave
- 533 N Campus Ave
- 505 N 8th Ave
- 494 N Campus Ave
- 669 E Arrow Hwy
- 545 N 8th Ave
- 543 N Campus Ave