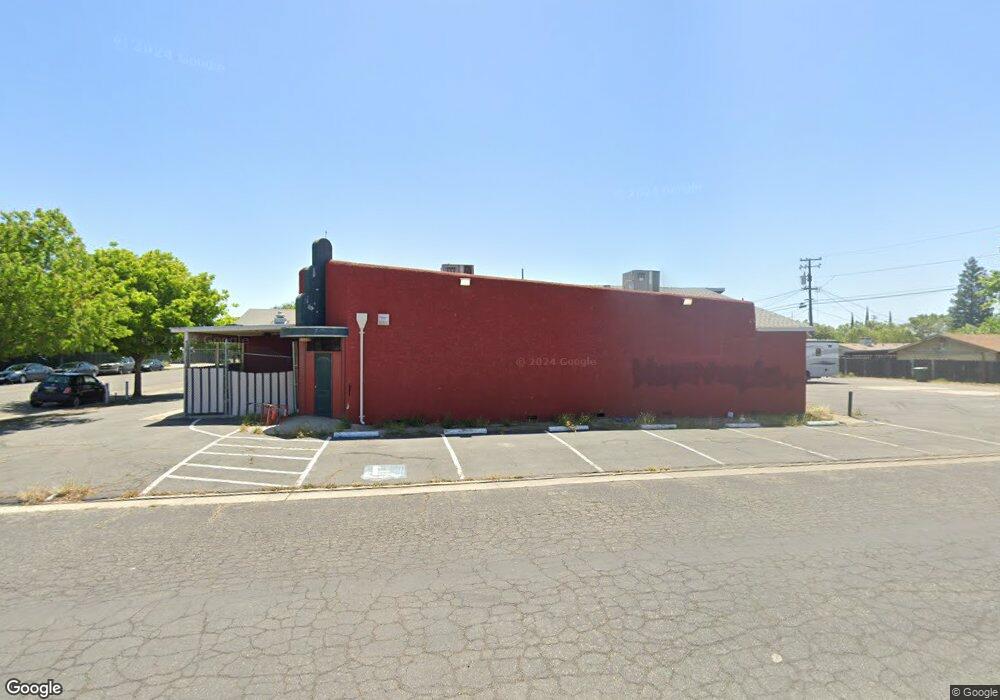
520 N Gateway Dr Madera, CA 93637
Downtown Madera NeighborhoodEstimated Value: $929,309
Studio
--
Bath
2,894
Sq Ft
$321/Sq Ft
Est. Value
About This Home
This home is located at 520 N Gateway Dr, Madera, CA 93637 and is currently estimated at $929,309, approximately $321 per square foot. 520 N Gateway Dr is a home located in Madera County with nearby schools including James Madison Elementary School, Thomas Jefferson Middle School, and Madera High School.
Ownership History
Date
Name
Owned For
Owner Type
Purchase Details
Closed on
Sep 18, 2021
Sold by
Dennis L Wright Revocable Living Trust and Wright Dennis L
Bought by
Kassim Akram and Kassim Mohsen Nayef
Current Estimated Value
Home Financials for this Owner
Home Financials are based on the most recent Mortgage that was taken out on this home.
Original Mortgage
$0
Interest Rate
2.8%
Mortgage Type
Balloon
Purchase Details
Closed on
May 14, 2007
Sold by
Wright Dennis L
Bought by
Livi Wright Dennis L and Livi Dennis L Wright Revocable
Purchase Details
Closed on
Jan 14, 2004
Sold by
Liv Davis Margaret L and Liv Margaret L Davis Revocable
Bought by
Wright Dennis L
Home Financials for this Owner
Home Financials are based on the most recent Mortgage that was taken out on this home.
Original Mortgage
$130,000
Interest Rate
5.39%
Mortgage Type
Commercial
Create a Home Valuation Report for This Property
The Home Valuation Report is an in-depth analysis detailing your home's value as well as a comparison with similar homes in the area
Home Values in the Area
Average Home Value in this Area
Purchase History
| Date | Buyer | Sale Price | Title Company |
|---|---|---|---|
| Kassim Akram | $800,000 | Chicago Title | |
| Livi Wright Dennis L | -- | None Available | |
| Wright Dennis L | $199,000 | Chicago Title |
Source: Public Records
Mortgage History
| Date | Status | Borrower | Loan Amount |
|---|---|---|---|
| Closed | Kassim Akram | $0 | |
| Previous Owner | Wright Dennis L | $130,000 | |
| Closed | Wright Dennis L | $104,000 |
Source: Public Records
Tax History
| Year | Tax Paid | Tax Assessment Tax Assessment Total Assessment is a certain percentage of the fair market value that is determined by local assessors to be the total taxable value of land and additions on the property. | Land | Improvement |
|---|---|---|---|---|
| 2025 | $10,265 | $886,908 | $132,651 | $754,257 |
| 2023 | $10,265 | $850,417 | $127,500 | $722,917 |
| 2022 | $9,569 | $832,779 | $125,000 | $707,779 |
| 2021 | $2,665 | $228,380 | $50,000 | $178,380 |
| 2020 | $5,022 | $422,280 | $93,000 | $329,280 |
| 2019 | $5,135 | $426,570 | $93,000 | $333,570 |
| 2018 | $4,911 | $433,750 | $93,000 | $340,750 |
| 2017 | $4,986 | $436,990 | $93,000 | $343,990 |
| 2016 | $5,080 | $447,820 | $93,000 | $354,820 |
| 2015 | $5,199 | $457,670 | $93,000 | $364,670 |
| 2014 | $5,156 | $476,570 | $120,000 | $356,570 |
Source: Public Records
Map
Nearby Homes
Your Personal Tour Guide
Ask me questions while you tour the home.