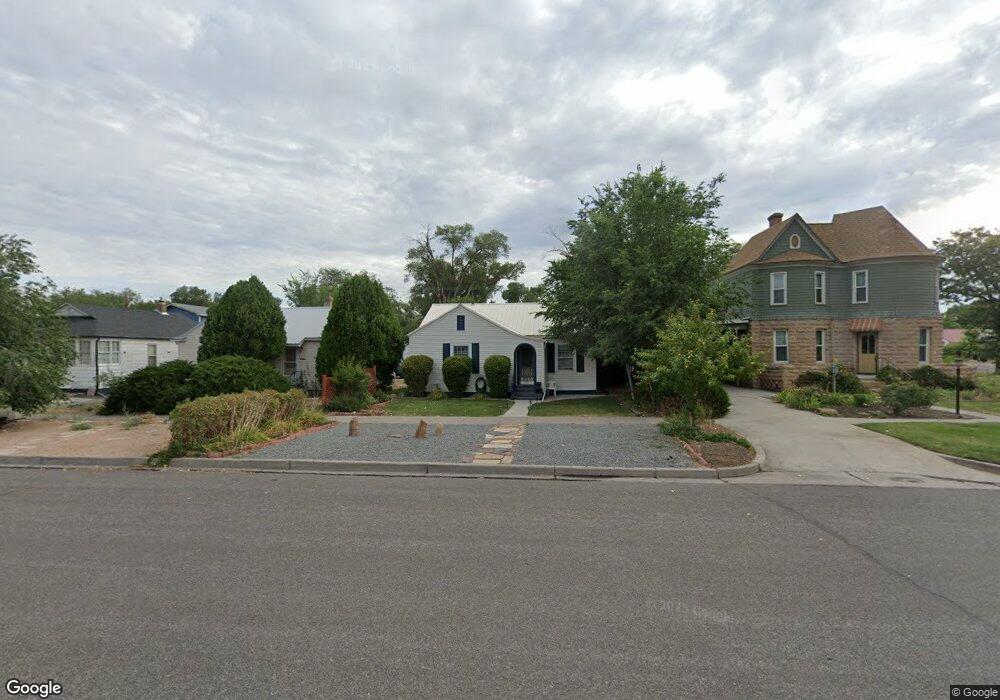
520 N Mesa Ave Montrose, CO 81401
Estimated Value: $333,238 - $374,000
2
Beds
2
Baths
1,370
Sq Ft
$257/Sq Ft
Est. Value
About This Home
This home is located at 520 N Mesa Ave, Montrose, CO 81401 and is currently estimated at $351,560, approximately $256 per square foot. 520 N Mesa Ave is a home located in Montrose County with nearby schools including Northside Elementary School, Centennial Middle School, and Montrose High School.
Ownership History
Date
Name
Owned For
Owner Type
Purchase Details
Closed on
Sep 21, 2023
Sold by
Stradley Linda J Sanbarg
Bought by
Sanburg Linda J and Jtwro Adriennne Drake
Current Estimated Value
Purchase Details
Closed on
Jun 21, 2001
Sold by
Sanburg Linda J
Bought by
Stradley Linda J Sanburg
Purchase Details
Closed on
Jun 3, 1996
Sold by
Lang Randall C and Lang Abigail S
Bought by
Sanburg Linda J
Purchase Details
Closed on
Dec 21, 1994
Sold by
Sullivan Matthew F and Sullivan Cynthia C
Bought by
Lang Randall C and Lang Abigail S
Purchase Details
Closed on
Nov 11, 1993
Sold by
Richmond Norman W and Richmond Jean W
Bought by
Sullivan Matthew F and Sullivan Cynthia C
Purchase Details
Closed on
Nov 7, 1986
Sold by
Weaver Judith A
Bought by
Richmond Norman W and Richmond Jean W
Purchase Details
Closed on
Dec 12, 1983
Sold by
Weaver Charles N
Bought by
Weaver Judith A
Purchase Details
Closed on
Jan 30, 1980
Sold by
Hughes John A and Hughes Josie
Bought by
Weaver Charles N and Weaver Judith A
Create a Home Valuation Report for This Property
The Home Valuation Report is an in-depth analysis detailing your home's value as well as a comparison with similar homes in the area
Home Values in the Area
Average Home Value in this Area
Purchase History
| Date | Buyer | Sale Price | Title Company |
|---|---|---|---|
| Sanburg Linda J | -- | None Listed On Document | |
| Stradley Linda J Sanburg | -- | -- | |
| Sanburg Linda J | $82,500 | -- | |
| Lang Randall C | $77,500 | -- | |
| Sullivan Matthew F | $58,000 | -- | |
| Richmond Norman W | $36,300 | -- | |
| Weaver Judith A | -- | -- | |
| Weaver Charles N | $32,000 | -- |
Source: Public Records
Tax History Compared to Growth
Tax History
| Year | Tax Paid | Tax Assessment Tax Assessment Total Assessment is a certain percentage of the fair market value that is determined by local assessors to be the total taxable value of land and additions on the property. | Land | Improvement |
|---|---|---|---|---|
| 2024 | $685 | $16,320 | $3,010 | $13,310 |
| 2023 | $685 | $20,740 | $3,820 | $16,920 |
| 2022 | $553 | $14,980 | $2,780 | $12,200 |
| 2021 | $569 | $15,410 | $2,860 | $12,550 |
| 2020 | $449 | $13,370 | $2,470 | $10,900 |
| 2019 | $451 | $13,370 | $2,470 | $10,900 |
| 2018 | $350 | $10,100 | $1,990 | $8,110 |
| 2017 | $347 | $10,100 | $1,990 | $8,110 |
| 2016 | $317 | $9,390 | $2,010 | $7,380 |
| 2015 | $623 | $9,390 | $2,010 | $7,380 |
| 2014 | $501 | $8,080 | $2,010 | $6,070 |
Source: Public Records
Map
Nearby Homes
- 701 N 4th St
- 700 N Nevada Ave
- 512 N 5th St
- 806 N Park Ave
- 638 N Cascade Ave
- 1201 N San Juan Ave
- 1037 N 1st St
- 218 N Stough Ave
- 338 N Stough Ave
- Lot 131 Haynes Drives
- 945 N Selig Ave
- 147 E Main St Unit 147 Main , 18 N Se
- TBD N Cedar
- 841 N Grand Ave
- TBD S 4th St
- TBD-Lot 31 Mayfly Dr
- TBD-Lot 18 Mayfly Dr
- TBD - Lot 6 Mayfly Dr
- TBD - Lot 16 Mayfly Dr
- TBD - Lot 7 Mayfly Dr