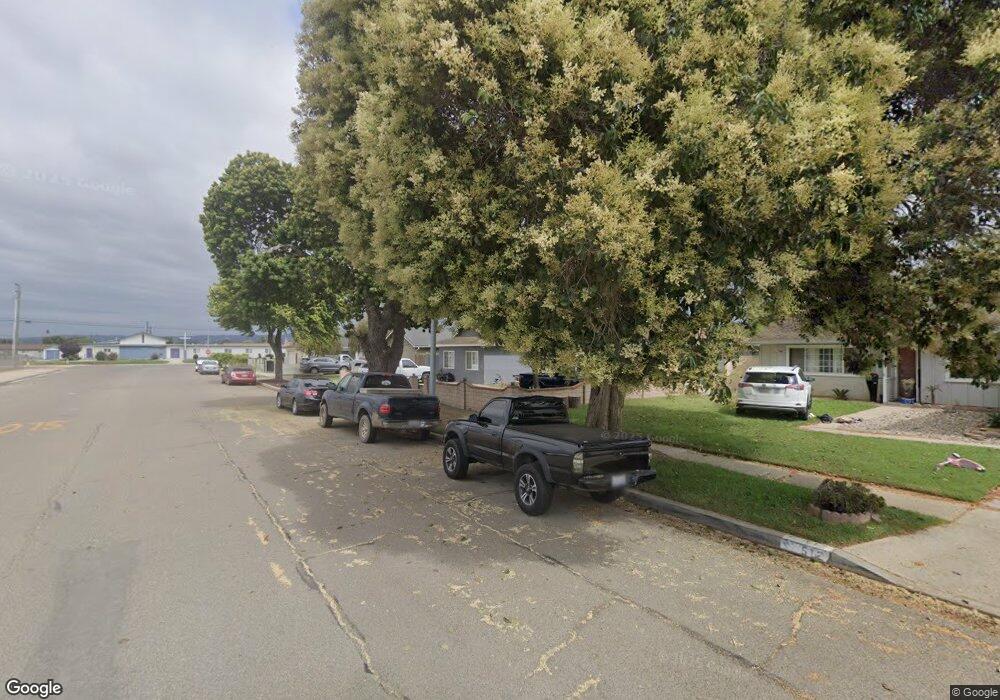
520 N W St Lompoc, CA 93436
Estimated Value: $583,000 - $660,000
5
Beds
2
Baths
2,171
Sq Ft
$292/Sq Ft
Est. Value
About This Home
This home is located at 520 N W St, Lompoc, CA 93436 and is currently estimated at $634,034, approximately $292 per square foot. 520 N W St is a home located in Santa Barbara County with nearby schools including Clarence Ruth Elementary School, Lompoc Valley Middle School, and Lompoc High School.
Ownership History
Date
Name
Owned For
Owner Type
Purchase Details
Closed on
Jun 9, 2021
Sold by
Osborn Beverly
Bought by
Miller Michelle Marie
Current Estimated Value
Home Financials for this Owner
Home Financials are based on the most recent Mortgage that was taken out on this home.
Original Mortgage
$515,490
Outstanding Balance
$466,712
Interest Rate
2.9%
Mortgage Type
FHA
Estimated Equity
$167,322
Purchase Details
Closed on
Sep 29, 1993
Sold by
Osborn Richard Lloyd and Osborn Judith E
Bought by
Osborn Beverly
Home Financials for this Owner
Home Financials are based on the most recent Mortgage that was taken out on this home.
Original Mortgage
$88,150
Interest Rate
7.13%
Create a Home Valuation Report for This Property
The Home Valuation Report is an in-depth analysis detailing your home's value as well as a comparison with similar homes in the area
Home Values in the Area
Average Home Value in this Area
Purchase History
| Date | Buyer | Sale Price | Title Company |
|---|---|---|---|
| Miller Michelle Marie | $525,000 | First American Title Company | |
| Osborn Beverly | -- | Stewart Title |
Source: Public Records
Mortgage History
| Date | Status | Borrower | Loan Amount |
|---|---|---|---|
| Open | Miller Michelle Marie | $515,490 | |
| Previous Owner | Osborn Beverly | $88,150 |
Source: Public Records
Tax History
| Year | Tax Paid | Tax Assessment Tax Assessment Total Assessment is a certain percentage of the fair market value that is determined by local assessors to be the total taxable value of land and additions on the property. | Land | Improvement |
|---|---|---|---|---|
| 2025 | $5,979 | $557,133 | $185,711 | $371,422 |
| 2023 | $5,979 | $535,500 | $178,500 | $357,000 |
| 2022 | $5,874 | $525,000 | $175,000 | $350,000 |
| 2021 | $1,255 | $111,119 | $13,846 | $97,273 |
| 2020 | $1,241 | $109,981 | $13,705 | $96,276 |
| 2019 | $1,219 | $107,826 | $13,437 | $94,389 |
| 2018 | $1,198 | $105,713 | $13,174 | $92,539 |
| 2017 | $1,174 | $103,641 | $12,916 | $90,725 |
| 2016 | $1,151 | $101,610 | $12,663 | $88,947 |
| 2014 | $1,124 | $98,124 | $12,229 | $85,895 |
Source: Public Records
Map
Nearby Homes
- 420 N W St
- 516 N U St
- 600 N Y St
- 321 N Z St
- 1408 W Walnut Ave
- 267 Village Circle Dr
- 112 N X St
- 230 N R St
- 1011 W Walnut Ave
- 1410 W Apricot Ave
- 23 Village Circle Dr
- 1311 W Cypress Ave Unit B2
- 1103 Point Sal Loop
- 1012 W Anthony Way
- 2205 Point Sal Loop
- 217 N M St
- 526 N L St
- 1212 Timothy Ct
- 1416 Glen Ellen Ln
- 400 Coronado Dr
Your Personal Tour Guide
Ask me questions while you tour the home.