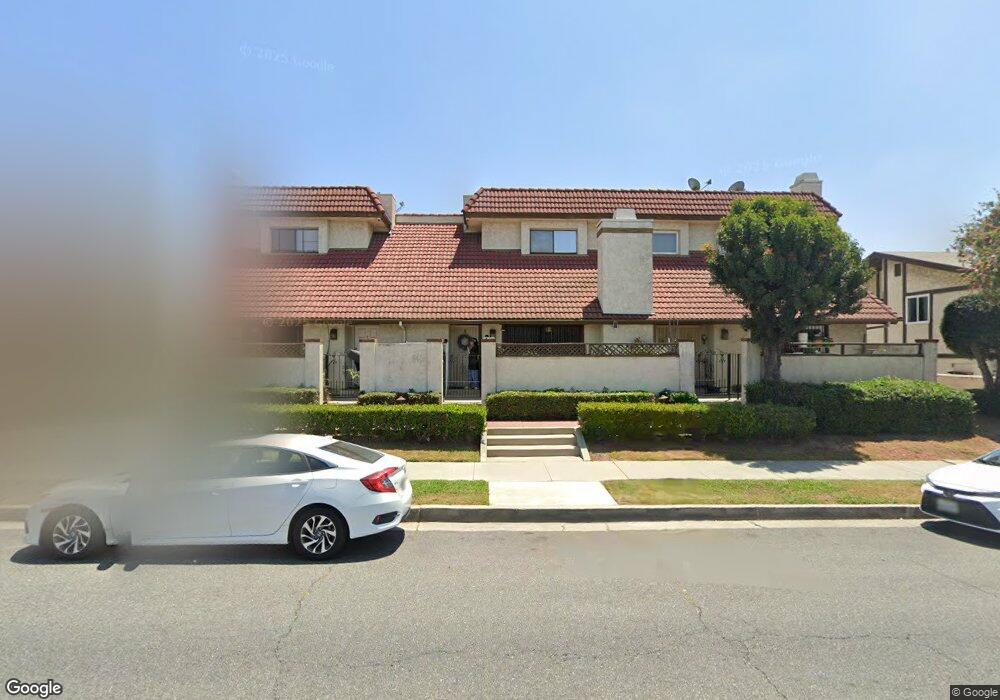
520 N Ynez Ave Unit B Monterey Park, CA 91754
Estimated Value: $721,948 - $862,000
3
Beds
3
Baths
1,513
Sq Ft
$539/Sq Ft
Est. Value
About This Home
This home is located at 520 N Ynez Ave Unit B, Monterey Park, CA 91754 and is currently estimated at $815,987, approximately $539 per square foot. 520 N Ynez Ave Unit B is a home located in Los Angeles County with nearby schools including Ynez Elementary School, Mark Keppel High School, and St. Stephen Martyr School.
Ownership History
Date
Name
Owned For
Owner Type
Purchase Details
Closed on
May 23, 2015
Sold by
Lei Kitchi
Bought by
The Kitchi Lei Living Trust
Current Estimated Value
Purchase Details
Closed on
May 19, 2015
Sold by
Leung Edward Yatwai and Leung Julia L
Bought by
Lei Kitchi
Purchase Details
Closed on
Jun 29, 2013
Sold by
Leung Edward Yatwan and Leung Julia L
Bought by
Leung Edward Yatwai and Leung Julia L
Purchase Details
Closed on
Nov 7, 2011
Sold by
Kwaitak Company
Bought by
Leung Edward Yatwai and Leung Julia L
Purchase Details
Closed on
Nov 4, 2002
Sold by
Kwaitak Company
Bought by
Kwaitak Company
Home Financials for this Owner
Home Financials are based on the most recent Mortgage that was taken out on this home.
Original Mortgage
$1,500,000
Interest Rate
5.88%
Purchase Details
Closed on
Feb 12, 1994
Sold by
Wijaya Jemmy
Bought by
Tang Li Fen
Purchase Details
Closed on
Feb 4, 1994
Sold by
Winata Romy
Bought by
Tang Li Fen
Create a Home Valuation Report for This Property
The Home Valuation Report is an in-depth analysis detailing your home's value as well as a comparison with similar homes in the area
Home Values in the Area
Average Home Value in this Area
Purchase History
| Date | Buyer | Sale Price | Title Company |
|---|---|---|---|
| The Kitchi Lei Living Trust | -- | None Available | |
| Lei Kitchi | -- | None Available | |
| Leung Edward Yatwai | -- | None Available | |
| Leung Edward Yatwai | $380,000 | Lawyers Title Co | |
| Kwaitak Company | -- | Stewart Title | |
| Tang Li Fen | $63,000 | Investors Title Company | |
| Tang Li Fen | -- | Investors Title Company |
Source: Public Records
Mortgage History
| Date | Status | Borrower | Loan Amount |
|---|---|---|---|
| Previous Owner | Kwaitak Company | $1,500,000 |
Source: Public Records
Tax History Compared to Growth
Tax History
| Year | Tax Paid | Tax Assessment Tax Assessment Total Assessment is a certain percentage of the fair market value that is determined by local assessors to be the total taxable value of land and additions on the property. | Land | Improvement |
|---|---|---|---|---|
| 2025 | $7,659 | $588,895 | $264,403 | $324,492 |
| 2024 | $7,659 | $577,349 | $259,219 | $318,130 |
| 2023 | $7,503 | $566,030 | $254,137 | $311,893 |
| 2022 | $7,146 | $554,932 | $249,154 | $305,778 |
| 2021 | $7,060 | $544,052 | $244,269 | $299,783 |
| 2019 | $6,808 | $527,918 | $237,025 | $290,893 |
| 2018 | $6,835 | $517,568 | $232,378 | $285,190 |
| 2016 | $6,315 | $497,472 | $223,355 | $274,117 |
| 2015 | $5,093 | $397,136 | $174,217 | $222,919 |
| 2014 | -- | $389,358 | $170,805 | $218,553 |
Source: Public Records
Map
Nearby Homes
- 516 N Moore Ave Unit A
- 500 N Moore Ave Unit E
- 513 W Emerson Ave Unit C
- 612 W Ramona Rd
- 2037 S 3rd St
- 419 N Chandler Ave Unit 508
- 419 N Chandler Ave Unit 311
- 419 N Chandler Ave Unit 308
- 419 N Chandler Ave Unit 413
- 419 N Chandler Ave Unit 305
- 419 N Chandler Ave Unit 319
- 215 W Garcelon Ave
- 600 N Atlantic Blvd Unit 516
- 600 N Atlantic Blvd Unit 508
- 600 N Atlantic Blvd Unit 207
- 305 N Baltimore Ave Unit C
- 0 N Atlantic Blvd Unit WS23107010
- 125 S Moore Ave Unit 2
- 406 N Lincoln Ave Unit A
- 215 N Lincoln Ave
- 524 N Ynez Ave Unit B
- 524 N Ynez Ave Unit A
- 518 N Ynez Ave Unit C
- 518 N Ynez Ave Unit B
- 518 N Ynez Ave Unit A
- 522 N Ynez Ave Unit C
- 522 N Ynez Ave Unit B
- 522 N Ynez Ave Unit A
- 526 N Ynez Ave Unit G
- 526 N Ynez Ave Unit F
- 526 N Ynez Ave Unit E
- 526 N Ynez Ave Unit D
- 526 N Ynez Ave Unit C
- 526 N Ynez Ave Unit B
- 526 N Ynez Ave Unit A
- 524 N Ynez Ave Unit C
- 520 N Ynez Ave
- 520 N Ynez Ave Unit C
- 520 N Ynez Ave Unit A
- 514 N Ynez Ave