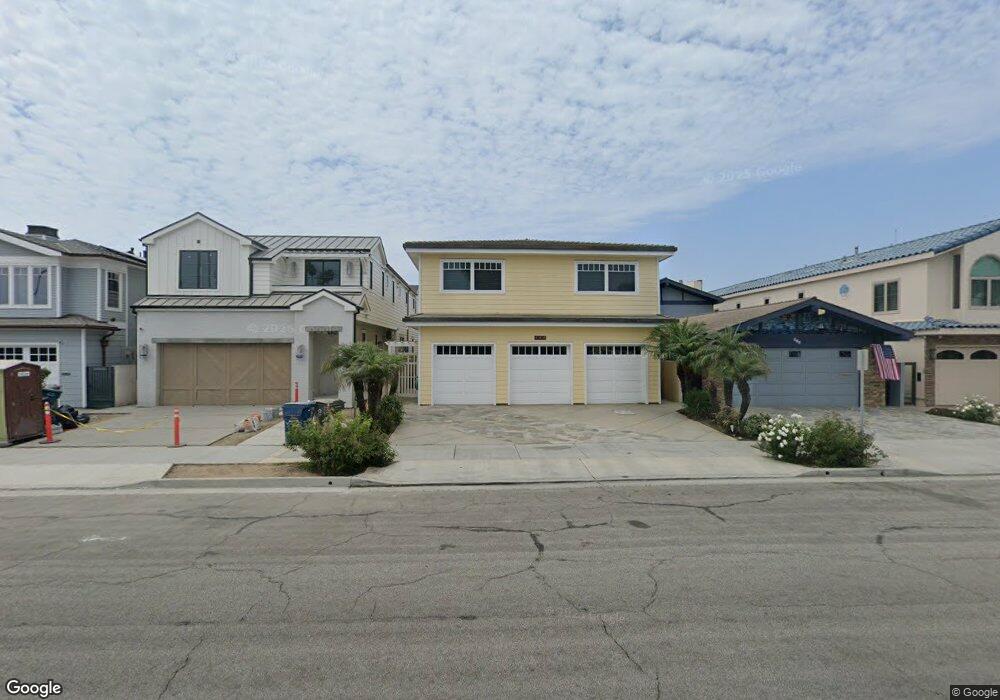
520 Ocean Ave Seal Beach, CA 90740
Estimated Value: $4,524,000 - $7,986,000
5
Beds
4
Baths
6,038
Sq Ft
$1,018/Sq Ft
Est. Value
About This Home
This home is located at 520 Ocean Ave, Seal Beach, CA 90740 and is currently estimated at $6,149,536, approximately $1,018 per square foot. 520 Ocean Ave is a home located in Orange County with nearby schools including J. H. Mcgaugh Elementary School, Jack L. Weaver Elementary School, and Sharon Christa Mcauliffe Middle School.
Ownership History
Date
Name
Owned For
Owner Type
Purchase Details
Closed on
Apr 20, 1999
Sold by
Womack Sandra Eichhorn Laurie
Bought by
Smith Stephen H and Smith Mary D
Current Estimated Value
Home Financials for this Owner
Home Financials are based on the most recent Mortgage that was taken out on this home.
Original Mortgage
$1,000,000
Interest Rate
6.94%
Purchase Details
Closed on
Mar 3, 1997
Sold by
Eichhorn Florence A
Bought by
Eichhorn Laurie and Austin Janice
Create a Home Valuation Report for This Property
The Home Valuation Report is an in-depth analysis detailing your home's value as well as a comparison with similar homes in the area
Home Values in the Area
Average Home Value in this Area
Purchase History
| Date | Buyer | Sale Price | Title Company |
|---|---|---|---|
| Smith Stephen H | $2,100,000 | -- | |
| Eichhorn Laurie | -- | -- |
Source: Public Records
Mortgage History
| Date | Status | Borrower | Loan Amount |
|---|---|---|---|
| Closed | Smith Stephen H | $1,000,000 |
Source: Public Records
Tax History
| Year | Tax Paid | Tax Assessment Tax Assessment Total Assessment is a certain percentage of the fair market value that is determined by local assessors to be the total taxable value of land and additions on the property. | Land | Improvement |
|---|---|---|---|---|
| 2025 | $48,341 | $4,405,195 | $3,154,715 | $1,250,480 |
| 2024 | $48,341 | $4,318,819 | $3,092,858 | $1,225,961 |
| 2023 | $47,299 | $4,234,137 | $3,032,214 | $1,201,923 |
| 2022 | $46,866 | $4,151,115 | $2,972,759 | $1,178,356 |
| 2021 | $45,827 | $4,069,721 | $2,914,470 | $1,155,251 |
| 2020 | $45,951 | $4,027,992 | $2,884,586 | $1,143,406 |
| 2019 | $44,507 | $3,949,012 | $2,828,025 | $1,120,987 |
| 2018 | $42,426 | $3,871,581 | $2,772,574 | $1,099,007 |
| 2017 | $41,540 | $3,795,668 | $2,718,210 | $1,077,458 |
| 2016 | $40,759 | $3,721,244 | $2,664,912 | $1,056,332 |
| 2015 | $40,276 | $3,665,348 | $2,624,883 | $1,040,465 |
| 2014 | $39,310 | $3,593,549 | $2,573,465 | $1,020,084 |
Source: Public Records
Map
Nearby Homes
- 10 Ocean Place
- 236 8th St
- 320 7th St
- 208 Ocean Place
- 315 Spinnaker Way
- 100 Electric Ave
- 328 Regatta Way
- 30 Welcome Ln
- 1301 Electric Ave
- 129 14th St
- 1400 Ocean Ave
- 48 Riversea Rd
- 85 Riversea Rd
- 915 Coastline Dr
- 216 15th St
- 1230 Crystal Cove Way
- 7019 E Seaside Walk
- 6911 E Ocean Blvd
- 1713 Electric Ave
- 6600 E Ocean Blvd
Your Personal Tour Guide
Ask me questions while you tour the home.