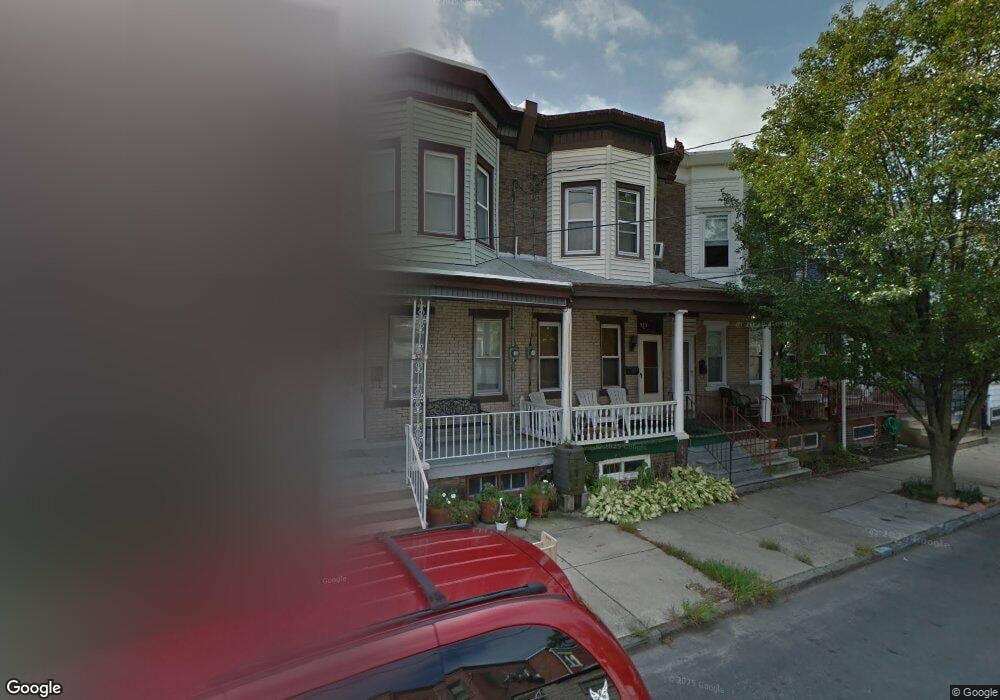
520 Paul St Gloucester City, NJ 08030
Estimated Value: $173,000 - $217,000
--
Bed
--
Bath
1,320
Sq Ft
$144/Sq Ft
Est. Value
About This Home
This home is located at 520 Paul St, Gloucester City, NJ 08030 and is currently estimated at $189,449, approximately $143 per square foot. 520 Paul St is a home located in Camden County with nearby schools including Cold Springs School, Gloucester City Middle School, and Gloucester City Junior/Senior High School.
Ownership History
Date
Name
Owned For
Owner Type
Purchase Details
Closed on
Jun 7, 2016
Sold by
Gallagher John A
Bought by
Gallagher John A and Gallagher Mary Beth
Current Estimated Value
Purchase Details
Closed on
Apr 25, 2003
Sold by
J A R Investments
Bought by
Gallagher John A
Home Financials for this Owner
Home Financials are based on the most recent Mortgage that was taken out on this home.
Original Mortgage
$62,000
Interest Rate
5.77%
Mortgage Type
VA
Purchase Details
Closed on
Oct 17, 2002
Sold by
Wachovia Bank
Bought by
J A R Investments
Create a Home Valuation Report for This Property
The Home Valuation Report is an in-depth analysis detailing your home's value as well as a comparison with similar homes in the area
Home Values in the Area
Average Home Value in this Area
Purchase History
| Date | Buyer | Sale Price | Title Company |
|---|---|---|---|
| Gallagher John A | -- | None Available | |
| Gallagher John A | $62,000 | -- | |
| J A R Investments | $30,500 | -- |
Source: Public Records
Mortgage History
| Date | Status | Borrower | Loan Amount |
|---|---|---|---|
| Previous Owner | Gallagher John A | $62,000 |
Source: Public Records
Tax History Compared to Growth
Tax History
| Year | Tax Paid | Tax Assessment Tax Assessment Total Assessment is a certain percentage of the fair market value that is determined by local assessors to be the total taxable value of land and additions on the property. | Land | Improvement |
|---|---|---|---|---|
| 2025 | $3,900 | $77,800 | $10,500 | $67,300 |
| 2024 | $3,893 | $77,800 | $10,500 | $67,300 |
| 2023 | $3,893 | $77,800 | $10,500 | $67,300 |
| 2022 | $3,660 | $77,800 | $10,500 | $67,300 |
| 2021 | $3,624 | $77,800 | $10,500 | $67,300 |
| 2020 | $3,499 | $77,800 | $10,500 | $67,300 |
| 2019 | $3,428 | $77,800 | $10,500 | $67,300 |
| 2018 | $3,361 | $77,800 | $10,500 | $67,300 |
| 2017 | $3,292 | $77,800 | $10,500 | $67,300 |
| 2016 | $3,167 | $77,800 | $10,500 | $67,300 |
| 2015 | $2,352 | $77,800 | $10,500 | $67,300 |
| 2014 | $2,338 | $54,100 | $8,200 | $45,900 |
Source: Public Records
Map
Nearby Homes