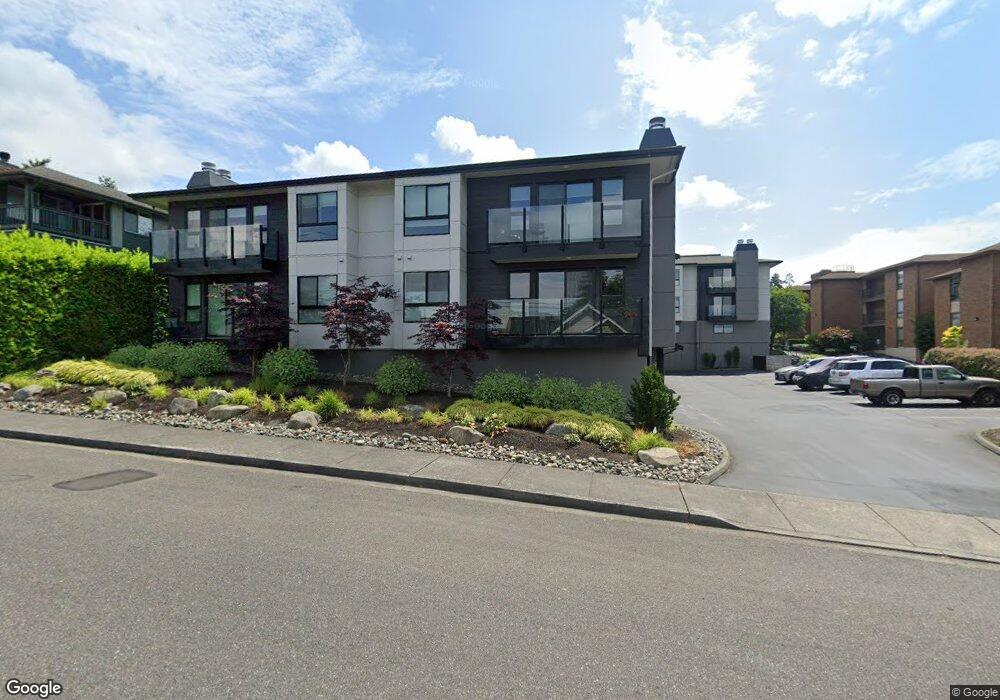
520 Pine St Unit A201 Edmonds, WA 98020
Pine Park NeighborhoodEstimated Value: $556,233 - $630,000
2
Beds
2
Baths
1,131
Sq Ft
$536/Sq Ft
Est. Value
About This Home
This home is located at 520 Pine St Unit A201, Edmonds, WA 98020 and is currently estimated at $606,558, approximately $536 per square foot. 520 Pine St Unit A201 is a home located in Snohomish County with nearby schools including Sherwood Elementary School, College Place Middle School, and Edmonds-Woodway High School.
Ownership History
Date
Name
Owned For
Owner Type
Purchase Details
Closed on
Jun 24, 2015
Sold by
Miller Stanley A and Miller Leslie E
Bought by
Logan Richard and Jones Barbara
Current Estimated Value
Home Financials for this Owner
Home Financials are based on the most recent Mortgage that was taken out on this home.
Original Mortgage
$236,000
Outstanding Balance
$171,413
Interest Rate
2.5%
Mortgage Type
New Conventional
Estimated Equity
$435,145
Purchase Details
Closed on
Oct 13, 2005
Sold by
Foss Hazel M
Bought by
Miller Stanley A and Miller Leslie E
Purchase Details
Closed on
May 15, 2002
Sold by
Wehde Zelta E
Bought by
Foss Hazel M
Home Financials for this Owner
Home Financials are based on the most recent Mortgage that was taken out on this home.
Original Mortgage
$150,000
Interest Rate
5.71%
Mortgage Type
Purchase Money Mortgage
Create a Home Valuation Report for This Property
The Home Valuation Report is an in-depth analysis detailing your home's value as well as a comparison with similar homes in the area
Home Values in the Area
Average Home Value in this Area
Purchase History
| Date | Buyer | Sale Price | Title Company |
|---|---|---|---|
| Logan Richard | $295,000 | Chicago Title Company | |
| Miller Stanley A | $285,000 | -- | |
| Foss Hazel M | $259,950 | First American |
Source: Public Records
Mortgage History
| Date | Status | Borrower | Loan Amount |
|---|---|---|---|
| Open | Logan Richard | $236,000 | |
| Previous Owner | Foss Hazel M | $150,000 |
Source: Public Records
Tax History
| Year | Tax Paid | Tax Assessment Tax Assessment Total Assessment is a certain percentage of the fair market value that is determined by local assessors to be the total taxable value of land and additions on the property. | Land | Improvement |
|---|---|---|---|---|
| 2026 | $3,186 | $545,100 | $176,000 | $369,100 |
| 2025 | $3,306 | $447,400 | $176,000 | $271,400 |
| 2024 | $3,306 | $463,300 | $176,000 | $287,300 |
| 2023 | $3,056 | $443,600 | $176,000 | $267,600 |
| 2022 | $3,229 | $385,700 | $160,000 | $225,700 |
| 2020 | $2,865 | $306,000 | $160,000 | $146,000 |
| 2019 | $2,844 | $306,000 | $160,000 | $146,000 |
| 2018 | $3,503 | $325,900 | $160,000 | $165,900 |
| 2017 | $2,507 | $244,000 | $97,000 | $147,000 |
| 2016 | $2,282 | $220,000 | $78,000 | $142,000 |
| 2015 | -- | $220,000 | $71,500 | $148,500 |
| 2013 | $2,336 | $200,000 | $79,500 | $120,500 |
Source: Public Records
Map
Nearby Homes
- 1020 5th Ave S Unit 2
- 960 5th Ave S Unit 208
- 1040 6th Ave S
- 550 Elm Way Unit 308
- 614 5th Ave S Unit C101
- 614 5th Ave S Unit C107
- 902 7th Ave S
- 556 Holly Dr
- 546 Walnut St Unit 201
- 432 3rd Ave S Unit B204
- 612 Elm Place
- 1226 6th Ave S Unit A102
- 624 Alder St
- 233 3rd Ave S Unit 305
- 712 Alder St
- 1108 9th Ave S
- 816 Walnut St
- 1221 Coronado Place
- 200 James St Unit 307
- 10815 Algonquin Rd
- 520 Pine St Unit 101
- 520 Pine St Unit 104
- 525 Forsyth Ln Unit B209
- 525 Forsyth Ln
- 525 Forsyth Ln Unit B207
- 525 Forsyth Ln
- 525 Forsyth Ln Unit B110
- 525 Forsyth Ln Unit B108
- 525 Forsyth Ln Unit B106
- 520 Pine St
- 520 Pine St Unit A203
- 520 Pine St Unit A202
- 520 Pine St Unit A105
- 520 Pine St
- 520 Pine St Unit A103
- 520 Pine St Unit A102
- 520 Pine St
- 525 Forsyth Ln Unit B109
- 525 Forsyth Ln
Your Personal Tour Guide
Ask me questions while you tour the home.