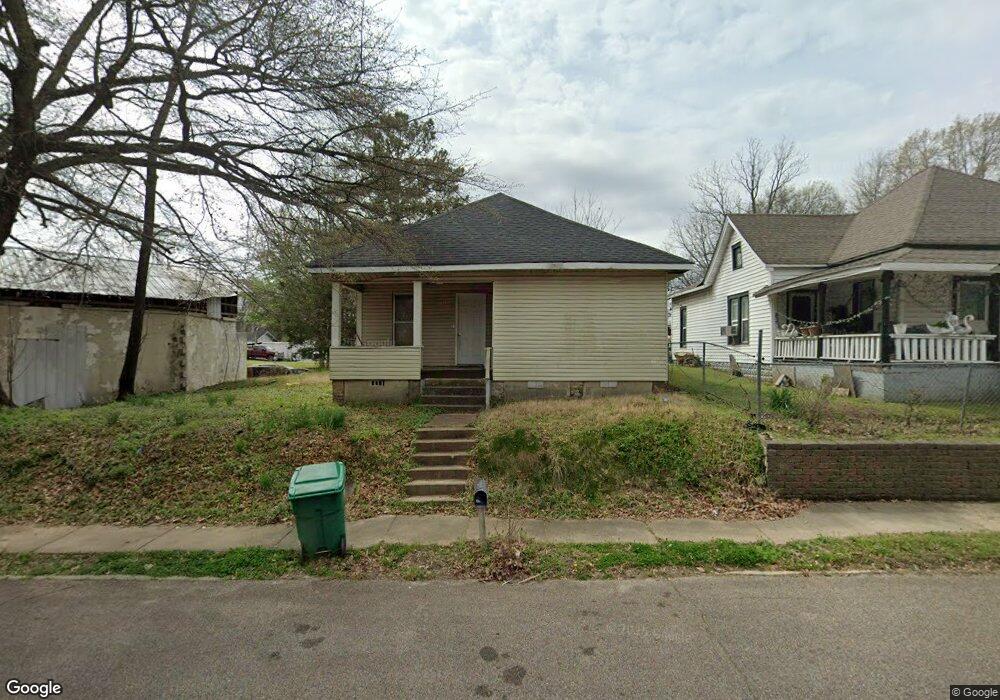
520 Preston St Jackson, TN 38301
Estimated Value: $52,776 - $132,000
3
Beds
1
Bath
1,032
Sq Ft
$73/Sq Ft
Est. Value
About This Home
This home is located at 520 Preston St, Jackson, TN 38301 and is currently estimated at $75,694, approximately $73 per square foot. 520 Preston St is a home located in Madison County with nearby schools including Lincoln Elementary School, North Parkway Middle School, and Liberty Technology Magnet High School.
Ownership History
Date
Name
Owned For
Owner Type
Purchase Details
Closed on
Jun 16, 2010
Sold by
The Bank Of New York
Bought by
Haltom Bartley
Current Estimated Value
Purchase Details
Closed on
Mar 25, 2010
Sold by
Harris Mary
Bought by
The Bank Of New York
Purchase Details
Closed on
Dec 28, 2004
Sold by
Eddie Barrett
Bought by
Mary Harris
Home Financials for this Owner
Home Financials are based on the most recent Mortgage that was taken out on this home.
Original Mortgage
$48,450
Interest Rate
5.63%
Purchase Details
Closed on
Sep 5, 2003
Bought by
Barrett Eddie
Purchase Details
Closed on
Jul 11, 2003
Sold by
Federal National Mortgage Association
Bought by
Edward Haltom
Purchase Details
Closed on
Dec 17, 2002
Sold by
Weiss Arnold M Sub Tr
Bought by
Federal National Mortgage
Purchase Details
Closed on
Jun 27, 1997
Sold by
Blalark L D
Bought by
Edward Haltom
Purchase Details
Closed on
Oct 11, 1989
Bought by
Blalark L D
Purchase Details
Closed on
Mar 1, 1972
Bought by
Jones Gus
Create a Home Valuation Report for This Property
The Home Valuation Report is an in-depth analysis detailing your home's value as well as a comparison with similar homes in the area
Purchase History
| Date | Buyer | Sale Price | Title Company |
|---|---|---|---|
| Haltom Bartley | $6,000 | -- | |
| The Bank Of New York | $55,678 | -- | |
| Mary Harris | $51,000 | -- | |
| Barrett Eddie | $17,500 | -- | |
| Edward Haltom | $9,900 | -- | |
| Federal National Mortgage | $39,200 | -- | |
| Edward Haltom | $8,000 | -- | |
| Blalark L D | -- | -- | |
| Jones Gus | -- | -- |
Source: Public Records
Mortgage History
| Date | Status | Borrower | Loan Amount |
|---|---|---|---|
| Previous Owner | Jones Gus | $48,450 |
Source: Public Records
Tax History
| Year | Tax Paid | Tax Assessment Tax Assessment Total Assessment is a certain percentage of the fair market value that is determined by local assessors to be the total taxable value of land and additions on the property. | Land | Improvement |
|---|---|---|---|---|
| 2025 | $196 | $10,450 | $875 | $9,575 |
| 2024 | $196 | $10,450 | $875 | $9,575 |
| 2022 | $364 | $10,450 | $875 | $9,575 |
| 2021 | $302 | $7,000 | $975 | $6,025 |
| 2020 | $302 | $7,000 | $975 | $6,025 |
| 2019 | $302 | $7,000 | $975 | $6,025 |
| 2018 | $302 | $7,000 | $975 | $6,025 |
| 2017 | $431 | $9,775 | $975 | $8,800 |
| 2016 | $402 | $9,775 | $975 | $8,800 |
| 2015 | $402 | $9,775 | $975 | $8,800 |
| 2014 | $402 | $9,775 | $975 | $8,800 |
Source: Public Records
Map
Nearby Homes
- 516 Preston St
- 514 Preston St
- 510 Preston St
- 612 1/2 Whitehall St
- 606 Whitehall St
- 612 Whitehall St
- 309 Jackson St
- 508 Preston St
- 415 Jackson St
- 614 Whitehall St
- 529 Preston St
- 507 Preston St
- 417 Jackson St
- 509 Preston St
- 533/533.5 Preston St
- 533 Preston St
- 503 Preston St
- 206 Faris St
- 432 Preston St
- 431 Jackson St
Your Personal Tour Guide
Ask me questions while you tour the home.