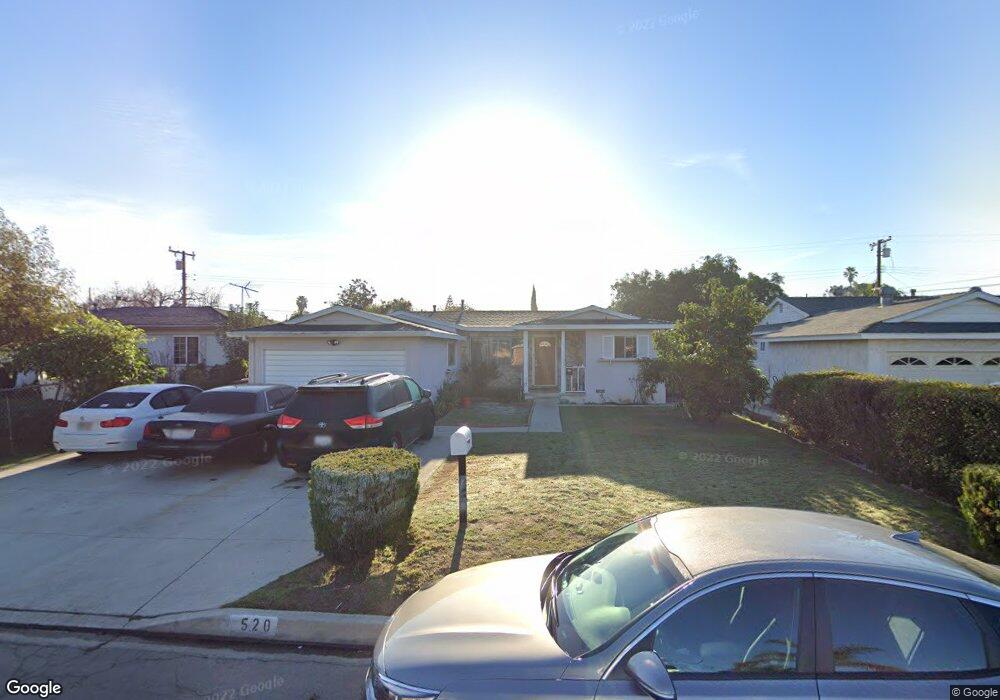
520 Radway Ave La Puente, CA 91744
Estimated Value: $683,000 - $789,000
4
Beds
2
Baths
1,603
Sq Ft
$470/Sq Ft
Est. Value
About This Home
This home is located at 520 Radway Ave, La Puente, CA 91744 and is currently estimated at $753,709, approximately $470 per square foot. 520 Radway Ave is a home located in Los Angeles County with nearby schools including Sparks Middle School, La Puente High School, and Hillside Baptist Academy.
Ownership History
Date
Name
Owned For
Owner Type
Purchase Details
Closed on
Nov 25, 2024
Sold by
Zabala Family Living Trust and Zabala Thomas
Bought by
Zabala Thomas and Zabala Eva L
Current Estimated Value
Home Financials for this Owner
Home Financials are based on the most recent Mortgage that was taken out on this home.
Original Mortgage
$371,387
Outstanding Balance
$368,427
Interest Rate
6.72%
Mortgage Type
FHA
Estimated Equity
$385,282
Purchase Details
Closed on
Mar 6, 2004
Sold by
Zabala Thomas
Bought by
Zabala Thomas and Zabala Eva L
Purchase Details
Closed on
Dec 14, 2001
Sold by
Villarreal Louis Luque
Bought by
Villarreal Louis Luque and Villarreal Ruth Herrera
Home Financials for this Owner
Home Financials are based on the most recent Mortgage that was taken out on this home.
Original Mortgage
$45,000
Interest Rate
6.51%
Mortgage Type
Credit Line Revolving
Purchase Details
Closed on
Mar 31, 2000
Sold by
Villarreal Louis
Bought by
Villarreal Louis Luque and Villarreal Ruth Herrera
Create a Home Valuation Report for This Property
The Home Valuation Report is an in-depth analysis detailing your home's value as well as a comparison with similar homes in the area
Home Values in the Area
Average Home Value in this Area
Purchase History
| Date | Buyer | Sale Price | Title Company |
|---|---|---|---|
| Zabala Thomas | -- | Provident Title Company | |
| Zabala Thomas | -- | -- | |
| Zabala Thomas | -- | -- | |
| Zabala Eva L | -- | -- | |
| Villarreal Louis Luque | -- | First American Title Ins Co | |
| Villarreal Louis Luque | -- | -- |
Source: Public Records
Mortgage History
| Date | Status | Borrower | Loan Amount |
|---|---|---|---|
| Open | Zabala Thomas | $371,387 | |
| Previous Owner | Villarreal Louis Luque | $45,000 |
Source: Public Records
Tax History Compared to Growth
Tax History
| Year | Tax Paid | Tax Assessment Tax Assessment Total Assessment is a certain percentage of the fair market value that is determined by local assessors to be the total taxable value of land and additions on the property. | Land | Improvement |
|---|---|---|---|---|
| 2025 | $1,371 | $71,545 | $19,822 | $51,723 |
| 2024 | $1,371 | $70,143 | $19,434 | $50,709 |
| 2023 | $1,342 | $68,768 | $19,053 | $49,715 |
| 2022 | $1,309 | $67,421 | $18,680 | $48,741 |
| 2021 | $1,278 | $66,100 | $18,314 | $47,786 |
| 2019 | $1,249 | $64,142 | $17,772 | $46,370 |
| 2018 | $1,138 | $62,885 | $17,424 | $45,461 |
| 2016 | $1,055 | $60,446 | $16,749 | $43,697 |
| 2015 | $1,037 | $59,539 | $16,498 | $43,041 |
| 2014 | $1,031 | $58,373 | $16,175 | $42,198 |
Source: Public Records
Map
Nearby Homes
- 14612 Hutchcroft St
- 750 Glenshaw Dr
- 14940 Beckner St
- 736 Tonopah Ave
- 822 Greenberry Dr
- 14972 Giordano St
- 829 Foxworth Ave
- 357 Cadbrook Dr
- 544 N Orange Ave Unit B
- 14421 Flynn St
- 14510 Amar Rd Unit J
- 932 Shadydale Ave
- 433 Sunkist Ave
- 15246 Temple Ave
- 610 Willow Ave
- 452 Willow Ave
- 15416 Giordano St
- 335 Willow Ave
- 1260 Greenberry Dr
- 13903 Moccasin St
- 526 Radway Ave
- 514 Radway Ave
- 521 Broadmoor Ave
- 527 Broadmoor Ave
- 515 Broadmoor Ave
- 508 Radway Ave
- 532 Radway Ave
- 521 Radway Ave
- 533 Broadmoor Ave
- 509 Broadmoor Ave
- 527 Radway Ave
- 515 Radway Ave
- 538 Radway Ave
- 502 Radway Ave
- 533 Radway Ave
- 509 Radway Ave
- 466 Radway Ave
- 539 Broadmoor Ave
- 503 Broadmoor Ave
- 539 Radway Ave