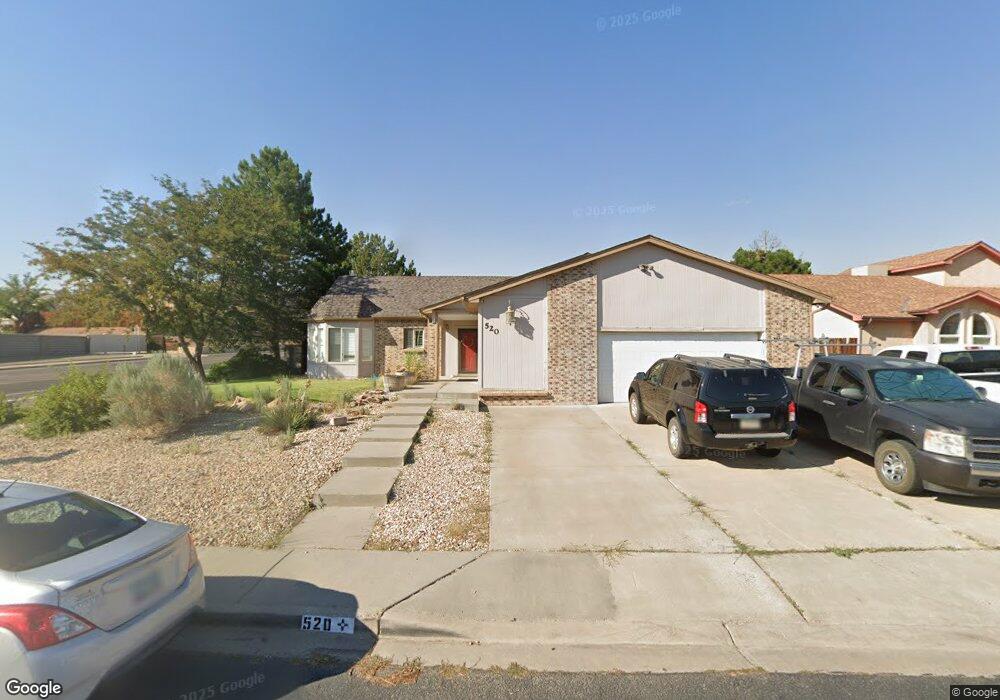
520 Teton Dr Farmington, NM 87401
Estimated Value: $343,000 - $417,000
--
Bed
--
Bath
1,927
Sq Ft
$199/Sq Ft
Est. Value
About This Home
This home is located at 520 Teton Dr, Farmington, NM 87401 and is currently estimated at $383,981, approximately $199 per square foot. 520 Teton Dr is a home located in San Juan County with nearby schools including Ladera Del Norte Elementary School, Hermosa Middle School, and Farmington High School.
Ownership History
Date
Name
Owned For
Owner Type
Purchase Details
Closed on
Mar 25, 2019
Sold by
Mobley Cody and Mobley Lori
Bought by
Beccani Carmelia J
Current Estimated Value
Home Financials for this Owner
Home Financials are based on the most recent Mortgage that was taken out on this home.
Original Mortgage
$214,225
Outstanding Balance
$188,340
Interest Rate
4.4%
Mortgage Type
New Conventional
Estimated Equity
$195,641
Purchase Details
Closed on
Sep 22, 2011
Sold by
Mobley Cody and Kirk Larry
Bought by
Mobley Cody and Cole Lori
Home Financials for this Owner
Home Financials are based on the most recent Mortgage that was taken out on this home.
Original Mortgage
$227,805
Interest Rate
4.4%
Mortgage Type
FHA
Purchase Details
Closed on
Jun 3, 2010
Sold by
Deutsche Bank National Trust Co
Bought by
Mobley Cody and Mobley Larry Kirk
Purchase Details
Closed on
Dec 23, 2009
Sold by
Twidt Chris A and Twidt Fran
Bought by
Mortgagfe Loan Asset Backed Certifivates
Create a Home Valuation Report for This Property
The Home Valuation Report is an in-depth analysis detailing your home's value as well as a comparison with similar homes in the area
Home Values in the Area
Average Home Value in this Area
Purchase History
| Date | Buyer | Sale Price | Title Company |
|---|---|---|---|
| Beccani Carmelia J | -- | None Available | |
| Mobley Cody | -- | None Available | |
| Mobley Cody | $225,000 | None Available | |
| Mortgagfe Loan Asset Backed Certifivates | -- | None Available |
Source: Public Records
Mortgage History
| Date | Status | Borrower | Loan Amount |
|---|---|---|---|
| Open | Beccani Carmelia J | $214,225 | |
| Previous Owner | Mobley Cody | $227,805 |
Source: Public Records
Tax History Compared to Growth
Tax History
| Year | Tax Paid | Tax Assessment Tax Assessment Total Assessment is a certain percentage of the fair market value that is determined by local assessors to be the total taxable value of land and additions on the property. | Land | Improvement |
|---|---|---|---|---|
| 2024 | $1,880 | $79,071 | $0 | $0 |
| 2023 | $1,880 | $76,768 | $0 | $0 |
| 2022 | $1,792 | $74,533 | $0 | $0 |
| 2021 | $1,726 | $72,362 | $0 | $0 |
| 2020 | $1,708 | $71,826 | $0 | $0 |
| 2019 | $1,704 | $72,015 | $0 | $0 |
| 2018 | $1,765 | $75,930 | $0 | $0 |
| 2017 | $1,742 | $75,930 | $0 | $0 |
| 2016 | $1,734 | $75,930 | $0 | $0 |
| 2015 | $1,705 | $75,930 | $0 | $0 |
| 2014 | $1,677 | $75,399 | $0 | $0 |
Source: Public Records
Map
Nearby Homes
- 520 Summer Solstice
- 641 Teton Dr
- 4202 Saint Michaels Dr
- 4300 Cardon Dr
- 4727 Calle Mio
- 2055 Pinon Hills Blvd
- XX Pinon Hills Blvd
- 4106 N Buena Vista Ave
- 4100 Saint Michaels Dr
- 4317 Casa Bonita Dr
- 1108 Campana Way
- 602 E Diamond St
- 3903 N Crescent Ave
- 4021 Vista Pinon Dr
- 2071 Harrier St
- 2080 Raptor St
- 2081 Harrier St
- NYA Glade Rd
- 3800 N Sunset Ave
- 605 E 37th St