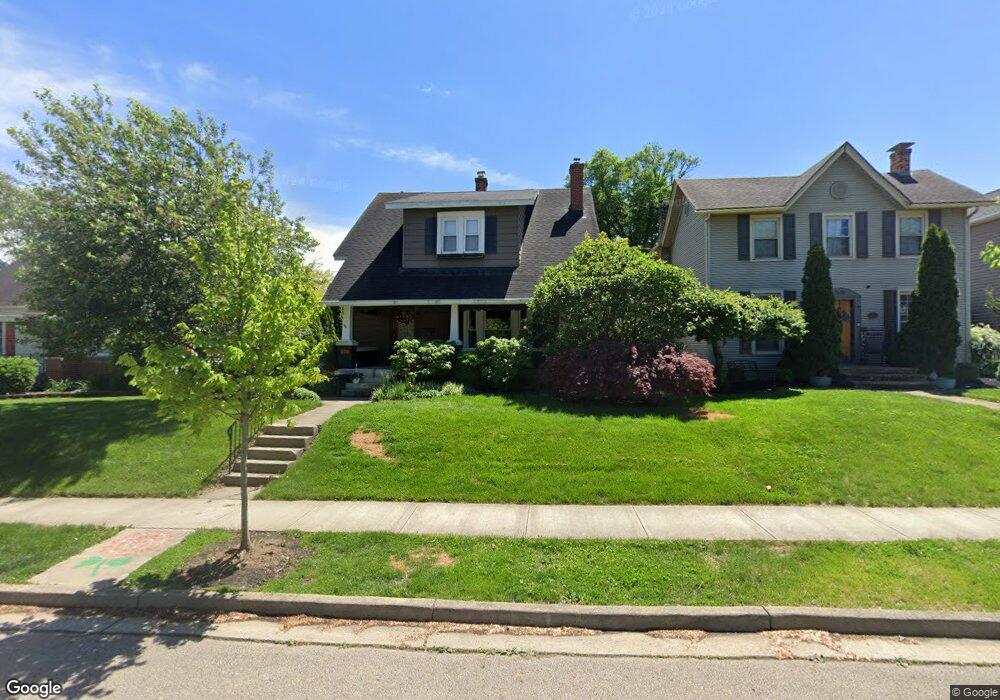
520 W Dow St Tipp City, OH 45371
Estimated Value: $245,072 - $284,000
3
Beds
2
Baths
1,540
Sq Ft
$172/Sq Ft
Est. Value
About This Home
This home is located at 520 W Dow St, Tipp City, OH 45371 and is currently estimated at $265,518, approximately $172 per square foot. 520 W Dow St is a home located in Miami County with nearby schools including Broadway Elementary School, Nevin Coppock Elementary School, and L. T. Ball Intermediate School.
Ownership History
Date
Name
Owned For
Owner Type
Purchase Details
Closed on
Nov 23, 2015
Sold by
Berbach John Leo and Berbach Karimey R
Bought by
Heeter Lucas D and Heeter Patricia A
Current Estimated Value
Home Financials for this Owner
Home Financials are based on the most recent Mortgage that was taken out on this home.
Original Mortgage
$130,500
Outstanding Balance
$102,610
Interest Rate
3.78%
Mortgage Type
New Conventional
Estimated Equity
$162,908
Purchase Details
Closed on
May 29, 2012
Sold by
Berbach John L and Berbach Patricia S
Bought by
Berbach John Leo and Berbach Karimey R
Home Financials for this Owner
Home Financials are based on the most recent Mortgage that was taken out on this home.
Original Mortgage
$118,750
Interest Rate
3.9%
Mortgage Type
New Conventional
Purchase Details
Closed on
Jul 10, 1995
Sold by
Jack D Cheadle
Bought by
Emilie A Evans
Create a Home Valuation Report for This Property
The Home Valuation Report is an in-depth analysis detailing your home's value as well as a comparison with similar homes in the area
Home Values in the Area
Average Home Value in this Area
Purchase History
| Date | Buyer | Sale Price | Title Company |
|---|---|---|---|
| Heeter Lucas D | $145,250 | Attorney | |
| Berbach John Leo | $125,000 | Sterling Land Title North Ll | |
| Emilie A Evans | $103,000 | -- |
Source: Public Records
Mortgage History
| Date | Status | Borrower | Loan Amount |
|---|---|---|---|
| Open | Heeter Lucas D | $130,500 | |
| Closed | Berbach John Leo | $118,750 | |
| Closed | Emilie A Evans | -- |
Source: Public Records
Tax History Compared to Growth
Tax History
| Year | Tax Paid | Tax Assessment Tax Assessment Total Assessment is a certain percentage of the fair market value that is determined by local assessors to be the total taxable value of land and additions on the property. | Land | Improvement |
|---|---|---|---|---|
| 2024 | $2,647 | $49,670 | $10,220 | $39,450 |
| 2023 | $2,647 | $49,670 | $10,220 | $39,450 |
| 2022 | $2,428 | $49,670 | $10,220 | $39,450 |
| 2021 | $2,335 | $43,190 | $8,890 | $34,300 |
| 2020 | $2,362 | $43,190 | $8,890 | $34,300 |
| 2019 | $2,382 | $43,190 | $8,890 | $34,300 |
| 2018 | $2,323 | $39,240 | $9,940 | $29,300 |
| 2017 | $2,331 | $39,240 | $9,940 | $29,300 |
| 2016 | $2,259 | $39,240 | $9,940 | $29,300 |
| 2015 | $1,756 | $35,040 | $8,890 | $26,150 |
| 2014 | $1,756 | $35,040 | $8,890 | $26,150 |
| 2013 | $1,765 | $35,040 | $8,890 | $26,150 |
Source: Public Records
Map
Nearby Homes
- 559 W Broadway St
- 1414 Ohio 571
- 36 Regency Square
- 100 Wunderwood Dr
- 546 Pinestead Dr
- 536 Michael Place
- 239 W Elm St
- 0 Ohio 571
- 28 Warner Dr
- 760 Rosedale Dr
- 5166 Catalpa Dr
- 140 Hartman Ave
- 423 S 2nd St
- 514 S 3rd St
- 397 Miles Ave
- 381 N 4th St
- 36 Wilhelm St
- 703 Nelson Ct
- 389 N Garber Dr
- 527 Bellaire Dr