Estimated Value: $231,000 - $284,000
5
Beds
2
Baths
1,260
Sq Ft
$209/Sq Ft
Est. Value
About This Home
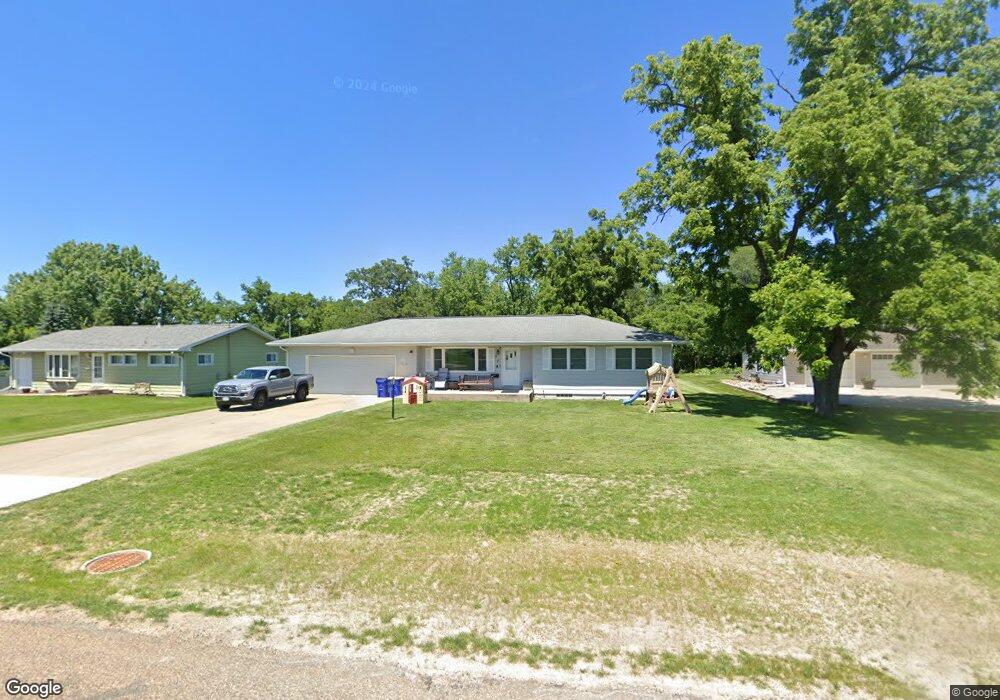
This home is located at 520 W Elm St, Solon, IA 52333 and is currently estimated at $263,948, approximately $209 per square foot. 520 W Elm St is a home located in Johnson County with nearby schools including Lakeview Elementary School, Solon Middle School, and Solon High School.
Ownership History
Date
Name
Owned For
Owner Type
Purchase Details
Closed on
Apr 7, 2017
Sold by
Hpr Investments Llc
Bought by
Linnell Patrick Charles
Current Estimated Value
Purchase Details
Closed on
Sep 23, 2011
Sold by
Randall Mary Jo
Bought by
Solon Properties Llc
Home Financials for this Owner
Home Financials are based on the most recent Mortgage that was taken out on this home.
Original Mortgage
$130,000
Interest Rate
4.32%
Mortgage Type
Purchase Money Mortgage
Create a Home Valuation Report for This Property
The Home Valuation Report is an in-depth analysis detailing your home's value as well as a comparison with similar homes in the area
Home Values in the Area
Average Home Value in this Area
Purchase History
| Date | Buyer | Sale Price | Title Company |
|---|---|---|---|
| Linnell Patrick Charles | $180,000 | None Available | |
| Hpr Investments Llc | -- | None Available | |
| Solon Properties Llc | $121,500 | None Available |
Source: Public Records
Mortgage History
| Date | Status | Borrower | Loan Amount |
|---|---|---|---|
| Previous Owner | Solon Properties Llc | $130,000 |
Source: Public Records
Tax History Compared to Growth
Tax History
| Year | Tax Paid | Tax Assessment Tax Assessment Total Assessment is a certain percentage of the fair market value that is determined by local assessors to be the total taxable value of land and additions on the property. | Land | Improvement |
|---|---|---|---|---|
| 2025 | $3,384 | $242,800 | $72,200 | $170,600 |
| 2024 | $3,286 | $209,900 | $72,200 | $137,700 |
| 2023 | $3,774 | $209,900 | $72,200 | $137,700 |
| 2022 | $3,730 | $205,900 | $62,600 | $143,300 |
| 2021 | $3,614 | $205,900 | $62,600 | $143,300 |
| 2020 | $3,614 | $191,500 | $48,200 | $143,300 |
| 2019 | $3,264 | $191,500 | $48,200 | $143,300 |
| 2018 | $3,368 | $171,700 | $48,200 | $123,500 |
| 2017 | $3,368 | $171,700 | $48,200 | $123,500 |
| 2016 | $2,726 | $165,400 | $48,200 | $117,200 |
| 2015 | $2,726 | $139,400 | $48,200 | $91,200 |
| 2014 | $2,606 | $132,100 | $48,200 | $83,900 |
Source: Public Records
Map
Nearby Homes
- 400 E Main St Unit 6
- 400 E Main St Unit 5
- 400 E Main St Unit 4
- 400 E Main St Unit 3
- 611 W Sovers St
- 1570 Volmert Ln NE
- Lot 119 Old Mill Creek
- 802 Mont Claire St
- 800 Mont Claire St
- 810 Crestview Dr
- 808 Crestview Dr
- 806 Crestview Dr
- Lot 118 Old Mill Creek
- Lot 102 Old Mill Creek
- Lot 84 Old Mill Creek
- Lot 120 Old Mill Creek
- Lot 104 Old Mill Creek
- Lot 117 Old Mill Creek
- Lot 101 Old Mill Creek
- Lot 85 Old Mill Creek