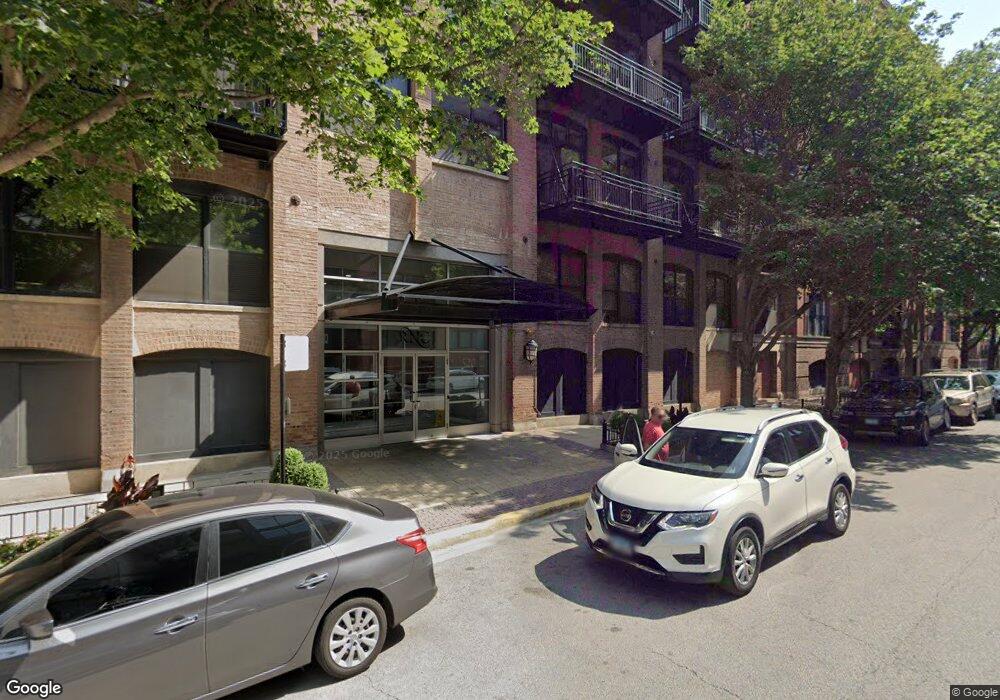
River North Commons 520 W Huron St Unit PUBS18 Chicago, IL 60654
River North NeighborhoodEstimated Value: $53,649 - $425,000
--
Bed
--
Bath
--
Sq Ft
1.74
Acres
About This Home
This home is located at 520 W Huron St Unit PUBS18, Chicago, IL 60654 and is currently estimated at $262,912. 520 W Huron St Unit PUBS18 is a home located in Cook County with nearby schools including Ogden Elementary School, Wells Community Academy High School, and Midwest Academy for Gifted Education, NFP (MAGE).
Ownership History
Date
Name
Owned For
Owner Type
Purchase Details
Closed on
Apr 14, 2020
Sold by
Applebaum Marc H
Bought by
Applebaum Marc H and Marc H Applebaum Trust
Current Estimated Value
Purchase Details
Closed on
Aug 22, 2013
Sold by
Simon Matthew K and Simon Julie
Bought by
Applebaum Marc H
Home Financials for this Owner
Home Financials are based on the most recent Mortgage that was taken out on this home.
Original Mortgage
$375,000
Outstanding Balance
$280,425
Interest Rate
4.53%
Mortgage Type
New Conventional
Estimated Equity
-$17,513
Purchase Details
Closed on
Jul 22, 2006
Sold by
Flershem Diane M
Bought by
Drommerhausen Michael
Purchase Details
Closed on
Nov 13, 2002
Sold by
Simon Matthew K
Bought by
Simon Matthew K and Simon Marcy
Home Financials for this Owner
Home Financials are based on the most recent Mortgage that was taken out on this home.
Original Mortgage
$300,000
Interest Rate
5.37%
Create a Home Valuation Report for This Property
The Home Valuation Report is an in-depth analysis detailing your home's value as well as a comparison with similar homes in the area
Home Values in the Area
Average Home Value in this Area
Purchase History
| Date | Buyer | Sale Price | Title Company |
|---|---|---|---|
| Applebaum Marc H | -- | Attorney | |
| Applebaum Marc H | $475,000 | Ravenswood Title Company Llc | |
| Drommerhausen Michael | -- | First American Title Ins Co | |
| Simon Matthew K | -- | Chicago Title Insurance Co |
Source: Public Records
Mortgage History
| Date | Status | Borrower | Loan Amount |
|---|---|---|---|
| Open | Applebaum Marc H | $375,000 | |
| Previous Owner | Simon Matthew K | $300,000 |
Source: Public Records
Tax History Compared to Growth
Tax History
| Year | Tax Paid | Tax Assessment Tax Assessment Total Assessment is a certain percentage of the fair market value that is determined by local assessors to be the total taxable value of land and additions on the property. | Land | Improvement |
|---|---|---|---|---|
| 2024 | $527 | $2,856 | $506 | $2,350 |
| 2023 | $514 | $2,501 | $411 | $2,090 |
| 2022 | $514 | $2,501 | $411 | $2,090 |
| 2021 | $503 | $2,499 | $410 | $2,089 |
| 2020 | $565 | $2,536 | $315 | $2,221 |
| 2019 | $553 | $2,753 | $315 | $2,438 |
| 2018 | $544 | $2,753 | $315 | $2,438 |
| 2017 | $523 | $2,430 | $268 | $2,162 |
| 2016 | $487 | $2,430 | $268 | $2,162 |
| 2015 | $445 | $2,430 | $268 | $2,162 |
| 2014 | $394 | $2,124 | $168 | $1,956 |
| 2013 | $386 | $2,124 | $168 | $1,956 |
Source: Public Records
About River North Commons
Map
Nearby Homes
- 520 W Huron St Unit 204
- 520 W Huron St Unit 109
- 520 W Huron St Unit GU57
- 676 N Kingsbury St Unit 104
- 525 W Superior St Unit 224
- 460 W Huron St
- 510 W Erie St Unit 1701
- 446 W Huron St Unit 450
- 451 W Huron St Unit P98
- 451 W Huron St Unit 1407
- 451 W Huron St Unit 505
- 451 W Huron St Unit P14
- 460 W Superior St Unit 7
- 700 N Larrabee St Unit 1406
- 700 N Larrabee St Unit 1111
- 500 W Superior St Unit 612
- 500 W Superior St Unit 1504
- 500 W Superior St Unit 1004
- 500 W Superior St Unit 1208
- 500 W Superior St Unit 1309
- 520 W Huron St Unit 603
- 520 W Huron St Unit 612
- 520 W Huron St Unit 510
- 520 W Huron St Unit 603
- 520 W Huron St Unit 510
- 520 W Huron St Unit 317
- 520 W Huron St Unit 201
- 520 W Huron St Unit 506
- 520 W Huron St
- 520 W Huron St Unit 309
- 520 W Huron St Unit 703
- 520 W Huron St Unit 510
- 520 W Huron St Unit 317
- 520 W Huron St Unit 201
- 520 W Huron St Unit 612
- 520 W Huron St Unit 703
- 520 W Huron St Unit PU1
- 520 W Huron St Unit PU29
- 520 W Huron St Unit 308
- 520 W Huron St Unit PUBS48