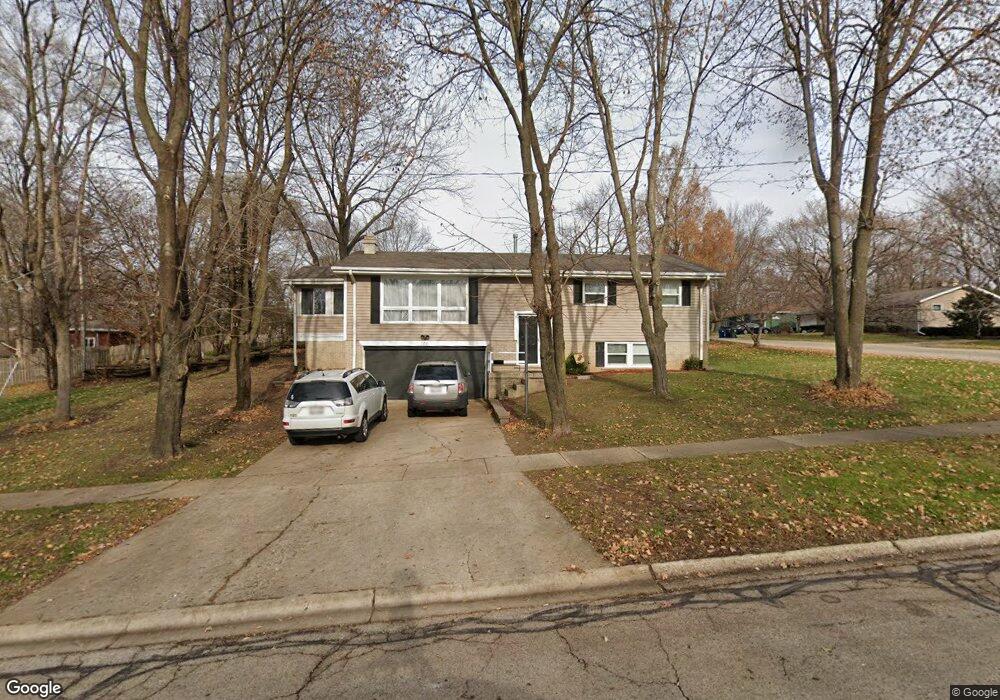
520 Webster St Algonquin, IL 60102
Estimated Value: $332,518 - $397,000
4
Beds
2
Baths
1,352
Sq Ft
$267/Sq Ft
Est. Value
About This Home
This home is located at 520 Webster St, Algonquin, IL 60102 and is currently estimated at $361,380, approximately $267 per square foot. 520 Webster St is a home located in McHenry County with nearby schools including Eastview Elementary School, Algonquin Middle School, and Dundee-Crown High School.
Ownership History
Date
Name
Owned For
Owner Type
Purchase Details
Closed on
Oct 31, 2024
Sold by
520 Webster Llc
Bought by
Herrmann Scott F and Herrmann Milagros
Current Estimated Value
Home Financials for this Owner
Home Financials are based on the most recent Mortgage that was taken out on this home.
Original Mortgage
$170,000
Outstanding Balance
$168,825
Interest Rate
8%
Mortgage Type
New Conventional
Estimated Equity
$192,556
Purchase Details
Closed on
Feb 5, 2008
Sold by
Herrmann Scott
Bought by
520 Webster Llc
Purchase Details
Closed on
Feb 2, 2008
Sold by
Graullera Roberto
Bought by
Herrmann Scott
Purchase Details
Closed on
Nov 23, 2004
Sold by
Frasor
Bought by
Midwest Bank & Trust and Trust #0438246
Create a Home Valuation Report for This Property
The Home Valuation Report is an in-depth analysis detailing your home's value as well as a comparison with similar homes in the area
Home Values in the Area
Average Home Value in this Area
Purchase History
| Date | Buyer | Sale Price | Title Company |
|---|---|---|---|
| Herrmann Scott F | -- | None Listed On Document | |
| 520 Webster Llc | -- | Multiple | |
| Herrmann Scott | $178,000 | Attorneys Title Guaranty | |
| Midwest Bank & Trust | $168,253 | -- |
Source: Public Records
Mortgage History
| Date | Status | Borrower | Loan Amount |
|---|---|---|---|
| Open | Herrmann Scott F | $170,000 |
Source: Public Records
Tax History Compared to Growth
Tax History
| Year | Tax Paid | Tax Assessment Tax Assessment Total Assessment is a certain percentage of the fair market value that is determined by local assessors to be the total taxable value of land and additions on the property. | Land | Improvement |
|---|---|---|---|---|
| 2024 | $7,043 | $90,027 | $11,409 | $78,618 |
| 2023 | $6,740 | $80,518 | $10,204 | $70,314 |
| 2022 | $5,869 | $68,431 | $13,837 | $54,594 |
| 2021 | $5,657 | $63,752 | $12,891 | $50,861 |
| 2020 | $5,522 | $61,495 | $12,435 | $49,060 |
| 2019 | $5,405 | $58,858 | $11,902 | $46,956 |
| 2018 | $5,183 | $54,372 | $10,995 | $43,377 |
| 2017 | $5,101 | $51,222 | $10,358 | $40,864 |
| 2016 | $5,052 | $48,042 | $9,715 | $38,327 |
| 2013 | -- | $50,358 | $9,063 | $41,295 |
Source: Public Records
Map
Nearby Homes
- 2 Sunset Ln
- 600 E Algonquin Rd
- 0 River Dr N Unit MRD12473279
- 1188 E Algonquin Rd
- 102 Center St
- 0 Natoma Trail
- 1114 Riverwood Dr Unit 1114
- 911 Old Oak Cir Unit 1
- 903 Old Oak Cir
- 920 Plymouth Ct
- lot 25 Wabican Trail
- 1245 Winaki Trail
- 9999 Sandbloom Rd
- 1659 E Algonquin Rd
- 314 Washington St
- 420 N Harrison St
- 620 Old Oak Cir
- Lot 4 b Ryan Pkwy
- 1770 E Algonquin Rd
- 925 N River Rd