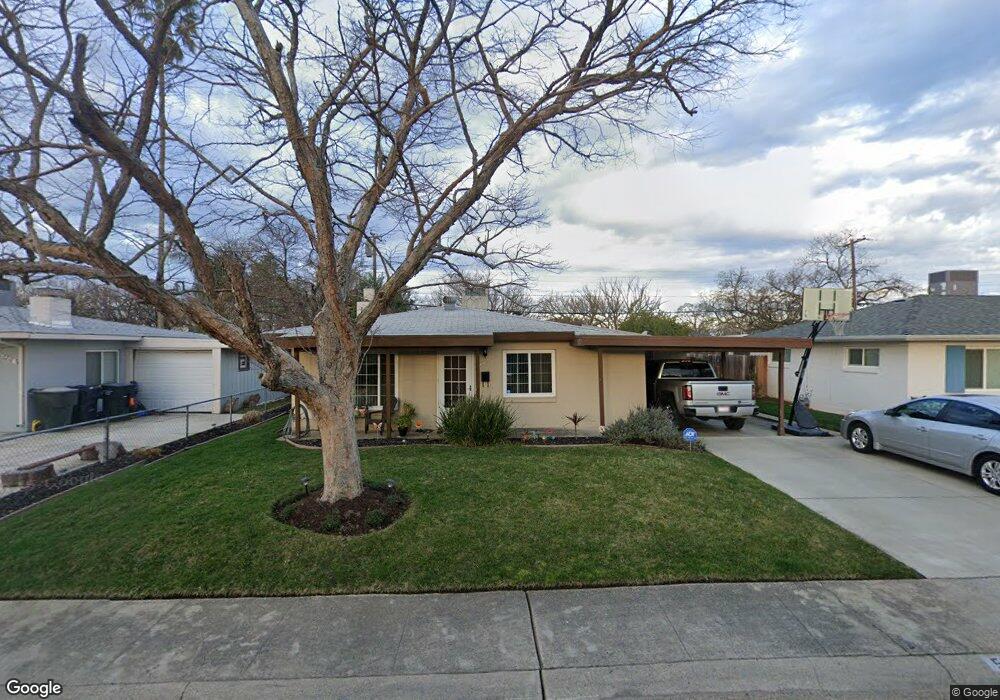
5200 60th St Sacramento, CA 95820
Tallac Village NeighborhoodEstimated Value: $291,000 - $385,000
3
Beds
1
Bath
1,039
Sq Ft
$335/Sq Ft
Est. Value
About This Home
This home is located at 5200 60th St, Sacramento, CA 95820 and is currently estimated at $348,270, approximately $335 per square foot. 5200 60th St is a home located in Sacramento County with nearby schools including Mark Twain Elementary School, Umoja International Academy, and Hiram W. Johnson High School.
Ownership History
Date
Name
Owned For
Owner Type
Purchase Details
Closed on
May 2, 2001
Sold by
Dougherty Thomas E and Dougherty Elizabeth S
Bought by
Escobar Jose Luis and Escobar Olga N
Current Estimated Value
Home Financials for this Owner
Home Financials are based on the most recent Mortgage that was taken out on this home.
Original Mortgage
$95,000
Outstanding Balance
$35,105
Interest Rate
6.89%
Estimated Equity
$313,165
Purchase Details
Closed on
Dec 5, 1995
Sold by
Dougherty Thomas E and Dougherty Elizabeth S
Bought by
Dougherty Thomas E and Dougherty Elizabeth S
Create a Home Valuation Report for This Property
The Home Valuation Report is an in-depth analysis detailing your home's value as well as a comparison with similar homes in the area
Home Values in the Area
Average Home Value in this Area
Purchase History
| Date | Buyer | Sale Price | Title Company |
|---|---|---|---|
| Escobar Jose Luis | $100,000 | North American Title Co | |
| Dougherty Thomas E | -- | -- |
Source: Public Records
Mortgage History
| Date | Status | Borrower | Loan Amount |
|---|---|---|---|
| Open | Escobar Jose Luis | $95,000 |
Source: Public Records
Tax History Compared to Growth
Tax History
| Year | Tax Paid | Tax Assessment Tax Assessment Total Assessment is a certain percentage of the fair market value that is determined by local assessors to be the total taxable value of land and additions on the property. | Land | Improvement |
|---|---|---|---|---|
| 2025 | $1,811 | $150,661 | $30,125 | $120,536 |
| 2024 | $1,811 | $147,708 | $29,535 | $118,173 |
| 2023 | $1,767 | $144,812 | $28,956 | $115,856 |
| 2022 | $1,734 | $141,974 | $28,389 | $113,585 |
| 2021 | $1,652 | $139,191 | $27,833 | $111,358 |
| 2020 | $1,662 | $137,765 | $27,548 | $110,217 |
| 2019 | $1,626 | $135,064 | $27,008 | $108,056 |
| 2018 | $1,582 | $132,417 | $26,479 | $105,938 |
| 2017 | $1,557 | $129,821 | $25,960 | $103,861 |
| 2016 | $1,500 | $127,276 | $25,451 | $101,825 |
| 2015 | $1,475 | $125,365 | $25,069 | $100,296 |
| 2014 | $1,436 | $122,910 | $24,578 | $98,332 |
Source: Public Records
Map
Nearby Homes