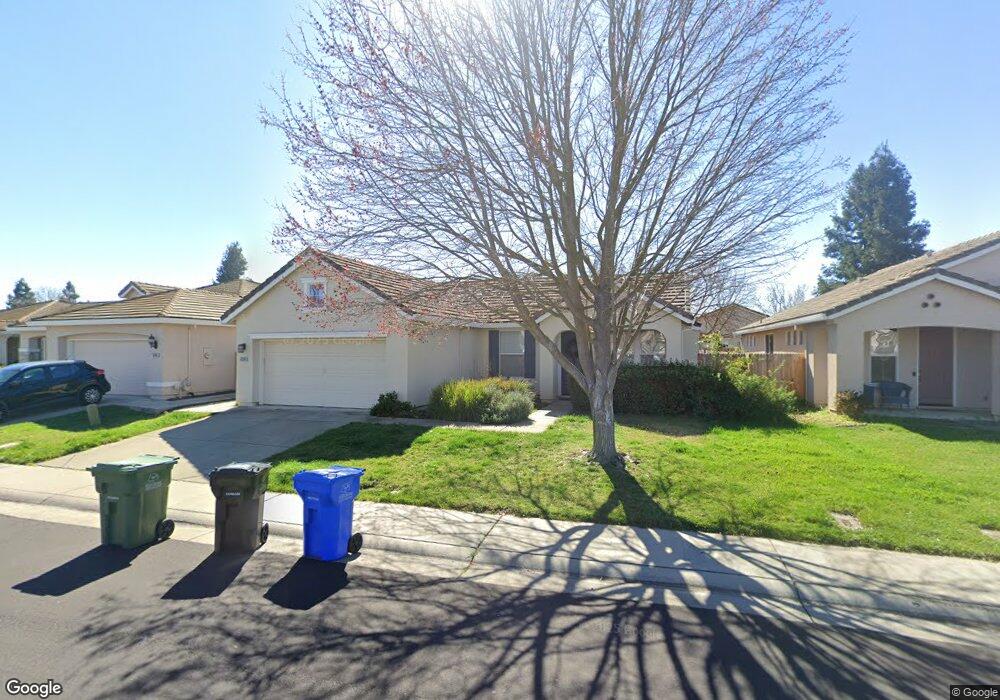
5200 Fox Trotter Way Elk Grove, CA 95757
South West Elk Grove NeighborhoodEstimated Value: $396,000 - $539,000
3
Beds
2
Baths
1,261
Sq Ft
$389/Sq Ft
Est. Value
About This Home
This home is located at 5200 Fox Trotter Way, Elk Grove, CA 95757 and is currently estimated at $491,046, approximately $389 per square foot. 5200 Fox Trotter Way is a home located in Sacramento County with nearby schools including Helen Carr Castello Elementary School, Toby Johnson Middle School, and Franklin High School.
Ownership History
Date
Name
Owned For
Owner Type
Purchase Details
Closed on
Aug 6, 2021
Sold by
Pipis Robert S
Bought by
Pipis Robert S and Robert And Tenney Hpis 2021 Re
Current Estimated Value
Purchase Details
Closed on
Aug 9, 2011
Sold by
Kenton Nancie
Bought by
Pipis Robert J
Home Financials for this Owner
Home Financials are based on the most recent Mortgage that was taken out on this home.
Original Mortgage
$166,250
Outstanding Balance
$114,518
Interest Rate
4.46%
Mortgage Type
Purchase Money Mortgage
Estimated Equity
$376,528
Purchase Details
Closed on
Sep 30, 2002
Sold by
Beazer Homes Holdings Corp
Bought by
Kenton Nancie
Home Financials for this Owner
Home Financials are based on the most recent Mortgage that was taken out on this home.
Original Mortgage
$172,000
Interest Rate
6.17%
Create a Home Valuation Report for This Property
The Home Valuation Report is an in-depth analysis detailing your home's value as well as a comparison with similar homes in the area
Home Values in the Area
Average Home Value in this Area
Purchase History
| Date | Buyer | Sale Price | Title Company |
|---|---|---|---|
| Pipis Robert S | -- | None Available | |
| Pipis Robert J | $175,000 | Stewart Title | |
| Kenton Nancie | $215,500 | First American Title Ins Co |
Source: Public Records
Mortgage History
| Date | Status | Borrower | Loan Amount |
|---|---|---|---|
| Open | Pipis Robert J | $166,250 | |
| Previous Owner | Kenton Nancie | $172,000 | |
| Closed | Kenton Nancie | $21,500 |
Source: Public Records
Tax History Compared to Growth
Tax History
| Year | Tax Paid | Tax Assessment Tax Assessment Total Assessment is a certain percentage of the fair market value that is determined by local assessors to be the total taxable value of land and additions on the property. | Land | Improvement |
|---|---|---|---|---|
| 2025 | $3,804 | $219,796 | $100,478 | $119,318 |
| 2024 | $3,804 | $215,487 | $98,508 | $116,979 |
| 2023 | $3,722 | $211,263 | $96,577 | $114,686 |
| 2022 | $3,673 | $207,122 | $94,684 | $112,438 |
| 2021 | $3,606 | $203,062 | $92,828 | $110,234 |
| 2020 | $3,566 | $200,981 | $91,877 | $109,104 |
| 2019 | $3,514 | $197,041 | $90,076 | $106,965 |
| 2018 | $3,446 | $193,178 | $88,310 | $104,868 |
| 2017 | $3,395 | $189,391 | $86,579 | $102,812 |
| 2016 | $3,290 | $185,679 | $84,882 | $100,797 |
| 2015 | $3,244 | $182,890 | $83,607 | $99,283 |
| 2014 | $3,216 | $179,309 | $81,970 | $97,339 |
Source: Public Records
Map
Nearby Homes
- 9634 Iris Meadow Way
- 9820 Spring View Way
- 9987 Spring View Way
- 5578 Lilyview Way
- 5817 Spring Flower Dr
- 4218 Ocean Ln
- 9910 Del Surf Ln
- 5109 Ocean Ln
- 10000 Asilomar Ln
- 6028 Travo Way
- 9529 Madrid Way
- 5537 Tares Cir
- 5512 Tares Cir Unit 5512
- 10084 Annie St
- 9425 S Wales Way
- 4950 Luckman Way
- 9952 Benevento Way
- 10065 Waterfield Dr
- 10128 Annie St
- 6612 Jarrett Ct
- 5204 Fox Trotter Way
- 5128 Fox Trotter Way
- 5125 Welsh Way
- 5208 Fox Trotter Way
- 5124 Fox Trotter Way
- 5201 Welsh Way
- 9826 Paso Fino Way
- 5121 Welsh Way
- 9827 Paso Fino Way
- 5120 Fox Trotter Way
- 5117 Welsh Way
- 9654 Iris Meadow Way
- 9822 Paso Fino Way
- 9827 Westfalen Way
- 9658 Iris Meadow Way
- 5205 Welsh Way
- 9823 Paso Fino Way
- 5116 Fox Trotter Way
- 9646 Iris Meadow Way
- 9662 Iris Meadow Way