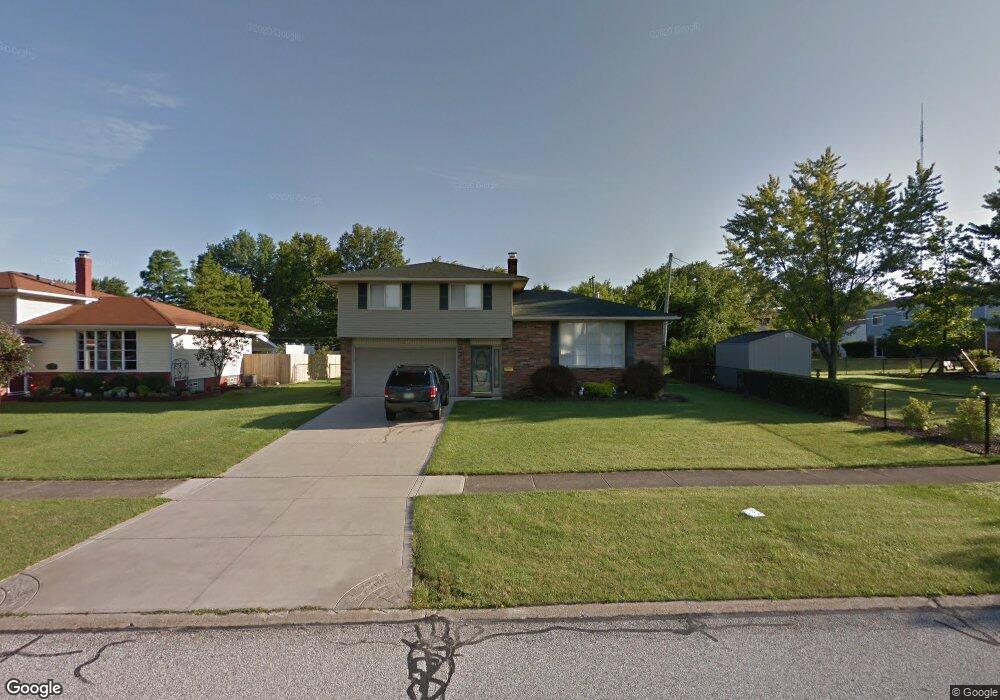
5200 Sequoia Dr Cleveland, OH 44134
Estimated Value: $263,133 - $303,000
3
Beds
2
Baths
1,390
Sq Ft
$201/Sq Ft
Est. Value
About This Home
This home is located at 5200 Sequoia Dr, Cleveland, OH 44134 and is currently estimated at $279,033, approximately $200 per square foot. 5200 Sequoia Dr is a home located in Cuyahoga County with nearby schools including Green Valley Elementary School, Normandy High School, and Hillside Middle School.
Ownership History
Date
Name
Owned For
Owner Type
Purchase Details
Closed on
Jun 14, 2019
Sold by
Kulak Keith and Kulak Keith E
Bought by
Jaenke Megan E
Current Estimated Value
Home Financials for this Owner
Home Financials are based on the most recent Mortgage that was taken out on this home.
Original Mortgage
$149,150
Outstanding Balance
$130,873
Interest Rate
4%
Mortgage Type
New Conventional
Estimated Equity
$148,160
Purchase Details
Closed on
Aug 16, 2006
Sold by
Kulak Diane
Bought by
Kulak Keith
Purchase Details
Closed on
Sep 16, 2004
Sold by
Slykerman Charles J and Slykerman Donna E
Bought by
Kulak Keith E
Home Financials for this Owner
Home Financials are based on the most recent Mortgage that was taken out on this home.
Original Mortgage
$165,404
Interest Rate
6.08%
Mortgage Type
FHA
Purchase Details
Closed on
Jan 31, 1992
Sold by
Amin Jitendra P and S J
Bought by
Slykerman Charles J
Purchase Details
Closed on
Jan 1, 1975
Bought by
Amin Jitendra P and S J
Create a Home Valuation Report for This Property
The Home Valuation Report is an in-depth analysis detailing your home's value as well as a comparison with similar homes in the area
Home Values in the Area
Average Home Value in this Area
Purchase History
| Date | Buyer | Sale Price | Title Company |
|---|---|---|---|
| Jaenke Megan E | $157,000 | Harvard Title | |
| Kulak Keith | -- | None Available | |
| Kulak Keith E | $168,000 | Land Title Agency | |
| Slykerman Charles J | $107,000 | -- | |
| Amin Jitendra P | -- | -- |
Source: Public Records
Mortgage History
| Date | Status | Borrower | Loan Amount |
|---|---|---|---|
| Open | Jaenke Megan E | $149,150 | |
| Previous Owner | Kulak Keith E | $165,404 |
Source: Public Records
Tax History Compared to Growth
Tax History
| Year | Tax Paid | Tax Assessment Tax Assessment Total Assessment is a certain percentage of the fair market value that is determined by local assessors to be the total taxable value of land and additions on the property. | Land | Improvement |
|---|---|---|---|---|
| 2024 | $4,633 | $74,375 | $16,765 | $57,610 |
| 2023 | $3,984 | $54,950 | $13,020 | $41,930 |
| 2022 | $3,951 | $54,950 | $13,020 | $41,930 |
| 2021 | $4,070 | $54,950 | $13,020 | $41,930 |
| 2020 | $4,038 | $48,550 | $10,190 | $38,360 |
| 2019 | $3,887 | $138,700 | $29,100 | $109,600 |
| 2018 | $3,747 | $48,550 | $10,190 | $38,360 |
| 2017 | $3,843 | $44,590 | $8,470 | $36,120 |
| 2016 | $3,820 | $44,590 | $8,470 | $36,120 |
| 2015 | $3,675 | $44,590 | $8,470 | $36,120 |
| 2014 | $3,675 | $45,960 | $8,720 | $37,240 |
Source: Public Records
Map
Nearby Homes
- 7531 Vista Dr
- 4477 Hialeah Dr
- 5500 Peachtree Ln S
- 4110 Pine Forest Dr
- 4591 W Sprague Rd
- 8053 Thornhurst Dr
- 4410 W Sprague Rd
- 6035 Woodland Bend Dr
- 4803 Sassafras Dr
- 7558 Pleasant View Dr
- 3350 Saint Andrews Dr
- 7987 Ridge Rd
- 7272 Normandy Dr
- 7580 S Pointe Ln
- 7596 S Pointe Ln
- 7351 S Pointe Ln
- Rosecliff Plan at South Pointe - Townhomes
- Caroline Plan at South Pointe - Townhomes
- 8373 Hunting Dr
- 6417 Thoreau Dr
- 5220 Sequoia Dr
- 7628 Roeper Rd
- 7622 Roeper Rd
- 5240 Sequoia Dr
- 5201 Woodbury Hills Dr
- 7616 Roeper Rd
- 5221 Woodbury Hills Dr
- 5241 Woodbury Hills Dr
- 5300 Sequoia Dr
- 5201 Sequoia Dr
- 5121 Sequoia Dr
- 7610 Roeper Rd
- 5221 Sequoia Dr
- 5101 Sequoia Dr
- 5301 Woodbury Hills Dr
- 5241 Sequoia Dr
- 5320 Sequoia Dr
- 5301 Sequoia Dr
- 7627 Roeper Rd
- 5321 Woodbury Hills Dr