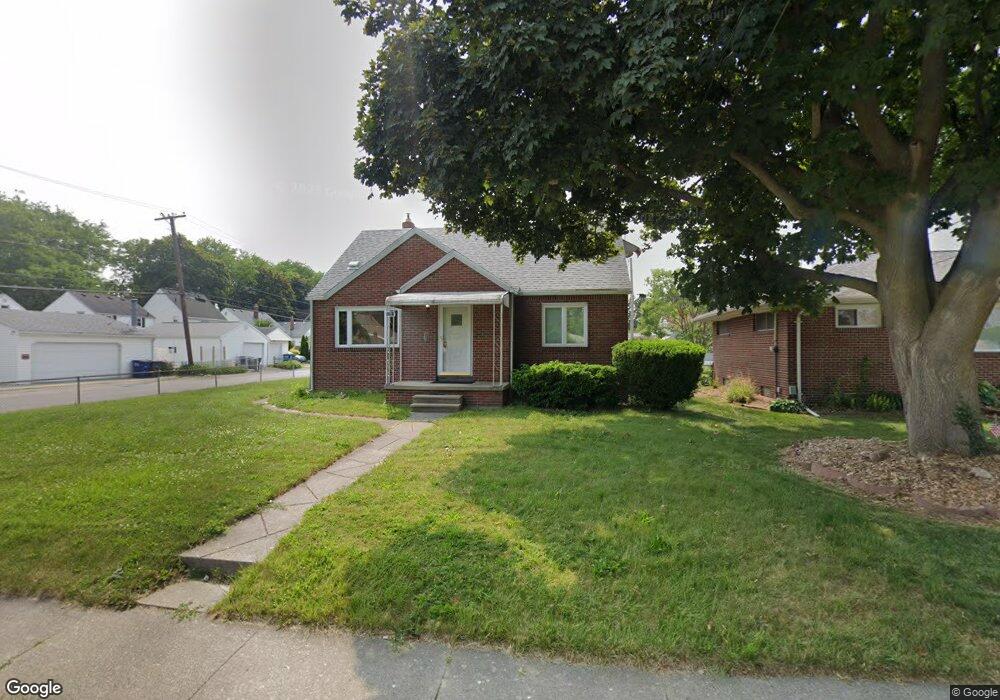
5201 303rd St Toledo, OH 43611
Point Place NeighborhoodEstimated Value: $140,000 - $162,000
3
Beds
1
Bath
1,539
Sq Ft
$97/Sq Ft
Est. Value
About This Home
This home is located at 5201 303rd St, Toledo, OH 43611 and is currently estimated at $149,334, approximately $97 per square foot. 5201 303rd St is a home located in Lucas County with nearby schools including Edgewater Elementary School, Woodward High School, and Imagine Environmental Science Academy.
Ownership History
Date
Name
Owned For
Owner Type
Purchase Details
Closed on
Dec 8, 2003
Sold by
Beneficial Ohio Inc
Bought by
Anderson Eric
Current Estimated Value
Home Financials for this Owner
Home Financials are based on the most recent Mortgage that was taken out on this home.
Original Mortgage
$90,500
Outstanding Balance
$41,819
Interest Rate
5.84%
Mortgage Type
Purchase Money Mortgage
Estimated Equity
$107,515
Purchase Details
Closed on
Jun 25, 2003
Sold by
Ditmyer Jerome D and Ditmyer Sandra
Bought by
Beneficial Ohio Inc and Beneficial Mortgage Co Of Ohio
Purchase Details
Closed on
May 4, 1992
Sold by
Trawinski Walter F
Create a Home Valuation Report for This Property
The Home Valuation Report is an in-depth analysis detailing your home's value as well as a comparison with similar homes in the area
Home Values in the Area
Average Home Value in this Area
Purchase History
| Date | Buyer | Sale Price | Title Company |
|---|---|---|---|
| Anderson Eric | $90,500 | Foundation Title Agency | |
| Beneficial Ohio Inc | -- | Multiple | |
| -- | $62,900 | -- |
Source: Public Records
Mortgage History
| Date | Status | Borrower | Loan Amount |
|---|---|---|---|
| Open | Anderson Eric | $90,500 |
Source: Public Records
Tax History Compared to Growth
Tax History
| Year | Tax Paid | Tax Assessment Tax Assessment Total Assessment is a certain percentage of the fair market value that is determined by local assessors to be the total taxable value of land and additions on the property. | Land | Improvement |
|---|---|---|---|---|
| 2024 | $1,098 | $33,005 | $7,980 | $25,025 |
| 2023 | $2,149 | $31,045 | $7,245 | $23,800 |
| 2022 | $2,140 | $31,045 | $7,245 | $23,800 |
| 2021 | $2,191 | $31,045 | $7,245 | $23,800 |
| 2020 | $2,106 | $25,725 | $5,985 | $19,740 |
| 2019 | $2,032 | $25,725 | $5,985 | $19,740 |
| 2018 | $2,003 | $25,725 | $5,985 | $19,740 |
| 2017 | $1,927 | $23,135 | $5,600 | $17,535 |
| 2016 | $1,951 | $66,100 | $16,000 | $50,100 |
| 2015 | $1,957 | $66,100 | $16,000 | $50,100 |
| 2014 | $1,455 | $23,140 | $5,600 | $17,540 |
| 2013 | $1,455 | $23,140 | $5,600 | $17,540 |
Source: Public Records
Map
Nearby Homes