5201 S Torrey Pines Dr Unit 4 Las Vegas, NV 89118
Spring Valley NeighborhoodEstimated Value: $340,000 - $369,000
2
Beds
3
Baths
1,467
Sq Ft
$243/Sq Ft
Est. Value
About This Home
This home is located at 5201 S Torrey Pines Dr Unit 4, Las Vegas, NV 89118 and is currently estimated at $355,945, approximately $242 per square foot. 5201 S Torrey Pines Dr Unit 4 is a home located in Clark County with nearby schools including Marion B Earl Elementary School, Grant Sawyer Middle School, and Durango High School.
Ownership History
Date
Name
Owned For
Owner Type
Purchase Details
Closed on
Aug 8, 2024
Sold by
Sacred Trust and Snyder Brandon Edward
Bought by
Curvin Lionel
Current Estimated Value
Purchase Details
Closed on
Feb 28, 2013
Sold by
Maneen Joseph M and Maneen Linda M
Bought by
Snyder Brandon Edward and Snyder Trust
Purchase Details
Closed on
Jun 22, 2005
Sold by
Patterson Janice K
Bought by
Maneen Joseph M and Maneen Linda M
Home Financials for this Owner
Home Financials are based on the most recent Mortgage that was taken out on this home.
Original Mortgage
$216,800
Interest Rate
5.48%
Mortgage Type
Fannie Mae Freddie Mac
Purchase Details
Closed on
Feb 18, 1994
Sold by
Patterson Janice K
Bought by
Patterson Janice K
Home Financials for this Owner
Home Financials are based on the most recent Mortgage that was taken out on this home.
Original Mortgage
$81,700
Interest Rate
6.98%
Create a Home Valuation Report for This Property
The Home Valuation Report is an in-depth analysis detailing your home's value as well as a comparison with similar homes in the area
Home Values in the Area
Average Home Value in this Area
Purchase History
| Date | Buyer | Sale Price | Title Company |
|---|---|---|---|
| Curvin Lionel | $360,000 | Roc Title | |
| Snyder Brandon Edward | $100,000 | Nevada Title Las Vegas | |
| Maneen Joseph M | $271,000 | Old Republic Title Co Of Nv | |
| Patterson Janice K | -- | Land Title |
Source: Public Records
Mortgage History
| Date | Status | Borrower | Loan Amount |
|---|---|---|---|
| Previous Owner | Maneen Joseph M | $216,800 | |
| Previous Owner | Patterson Janice K | $81,700 |
Source: Public Records
Tax History Compared to Growth
Tax History
| Year | Tax Paid | Tax Assessment Tax Assessment Total Assessment is a certain percentage of the fair market value that is determined by local assessors to be the total taxable value of land and additions on the property. | Land | Improvement |
|---|---|---|---|---|
| 2025 | $1,209 | $63,437 | $26,250 | $37,187 |
| 2024 | $1,174 | $63,437 | $26,250 | $37,187 |
| 2023 | $1,174 | $66,805 | $32,200 | $34,605 |
| 2022 | $1,140 | $57,404 | $25,200 | $32,204 |
| 2021 | $1,107 | $54,469 | $23,100 | $31,369 |
| 2020 | $1,071 | $54,394 | $23,100 | $31,294 |
| 2019 | $1,040 | $49,703 | $18,480 | $31,223 |
| 2018 | $1,010 | $45,270 | $14,700 | $30,570 |
| 2017 | $1,311 | $44,710 | $13,350 | $31,360 |
| 2016 | $958 | $40,149 | $9,240 | $30,909 |
| 2015 | $955 | $33,202 | $6,720 | $26,482 |
| 2014 | $927 | $30,851 | $6,300 | $24,551 |
Source: Public Records
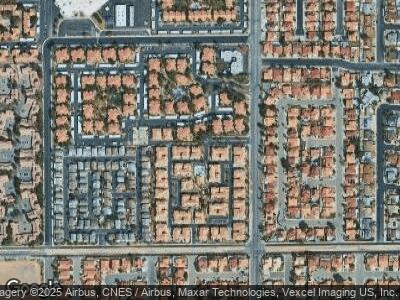
Map
Nearby Homes
- 5201 S Torrey Pines Dr Unit 1253
- 5201 S Torrey Pines Dr Unit 1184
- 5201 S Torrey Pines Dr Unit 1244
- 5263 Shasta Lake Way
- 5255 Autumn Sky Rd
- 5236 Ladyhawk Way
- 5440 Regal Peak Dr
- 5250 S Rainbow Blvd Unit 1010
- 5250 S Rainbow Blvd Unit 2029
- 5250 S Rainbow Blvd Unit 1140
- 5250 S Rainbow Blvd Unit 2106
- 5250 S Rainbow Blvd Unit 1084
- 5250 S Rainbow Blvd Unit 1144
- 5250 S Rainbow Blvd Unit 1131
- 5250 S Rainbow Blvd Unit 2046
- 5250 S Rainbow Blvd Unit 1165
- 5250 S Rainbow Blvd Unit 2165
- 5250 S Rainbow Blvd Unit 1121
- 5250 S Rainbow Blvd Unit 2120
- 5250 S Rainbow Blvd Unit 2158
- 5201 S Torrey Pines Dr Unit 1221
- 5201 S Torrey Pines Dr Unit 4
- 5201 S Torrey Pines Dr Unit 2
- 5201 S Torrey Pines Dr Unit 1215
- 5201 S Torrey Pines Dr Unit 1224
- 5201 S Torrey Pines Dr Unit 1218
- 5201 S Torrey Pines Dr Unit 1259
- 5201 S Torrey Pines Dr Unit 1208
- 5201 S Torrey Pines Dr Unit 1263
- 5201 S Torrey Pines Dr Unit 1261
- 5201 S Torrey Pines Dr Unit n/a
- 5201 S Torrey Pines Dr Unit 1250
- 5201 S Torrey Pines Dr Unit 1238
- 5201 S Torrey Pines Dr Unit 1281
- 5201 S Torrey Pines Dr Unit 1198
- 5201 S Torrey Pines Dr Unit 1187
- 5201 S Torrey Pines Dr Unit 1188
- 5201 S Torrey Pines Dr Unit 1246
- 5201 S Torrey Pines Dr Unit 1273
- 5201 S Torrey Pines Dr Unit 1178