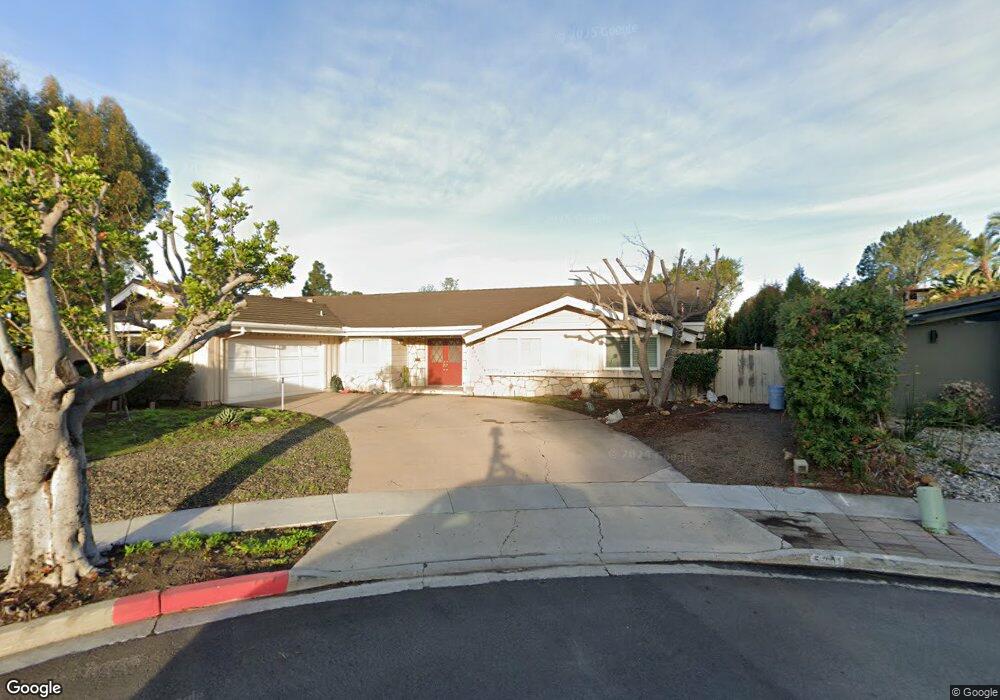
5201 Stone Ct San Diego, CA 92115
College West NeighborhoodEstimated Value: $1,416,000 - $1,553,472
4
Beds
3
Baths
2,818
Sq Ft
$522/Sq Ft
Est. Value
About This Home
This home is located at 5201 Stone Ct, San Diego, CA 92115 and is currently estimated at $1,470,118, approximately $521 per square foot. 5201 Stone Ct is a home located in San Diego County with nearby schools including Hardy Elementary School, Lewis Middle School, and Patrick Henry High School.
Ownership History
Date
Name
Owned For
Owner Type
Purchase Details
Closed on
Oct 26, 2016
Sold by
Levin Rand V and Levin Naomi E
Bought by
Calderon Roberto A and Johnson Karen
Current Estimated Value
Home Financials for this Owner
Home Financials are based on the most recent Mortgage that was taken out on this home.
Original Mortgage
$68,931
Outstanding Balance
$55,340
Interest Rate
3.42%
Mortgage Type
Credit Line Revolving
Estimated Equity
$1,414,778
Purchase Details
Closed on
Dec 18, 2001
Sold by
Levin Rand V
Bought by
Levin Rand and Levin Naomi E
Purchase Details
Closed on
Jul 16, 1998
Sold by
Levin Naomi Elaine
Bought by
Levin Rand
Home Financials for this Owner
Home Financials are based on the most recent Mortgage that was taken out on this home.
Original Mortgage
$220,000
Interest Rate
6.88%
Purchase Details
Closed on
Jul 7, 1998
Sold by
Murdock Stanley M and Murdock Mildred M
Bought by
Levin Rand
Home Financials for this Owner
Home Financials are based on the most recent Mortgage that was taken out on this home.
Original Mortgage
$220,000
Interest Rate
6.88%
Create a Home Valuation Report for This Property
The Home Valuation Report is an in-depth analysis detailing your home's value as well as a comparison with similar homes in the area
Home Values in the Area
Average Home Value in this Area
Purchase History
| Date | Buyer | Sale Price | Title Company |
|---|---|---|---|
| Calderon Roberto A | $690,000 | Corinthian Title | |
| Levin Rand | -- | -- | |
| Levin Rand | -- | Commonwealth Land Title Co | |
| Levin Rand | $320,000 | Commonwealth Land Title Co |
Source: Public Records
Mortgage History
| Date | Status | Borrower | Loan Amount |
|---|---|---|---|
| Open | Calderon Roberto A | $68,931 | |
| Open | Calderon Roberto A | $552,000 | |
| Previous Owner | Levin Rand | $220,000 |
Source: Public Records
Tax History Compared to Growth
Tax History
| Year | Tax Paid | Tax Assessment Tax Assessment Total Assessment is a certain percentage of the fair market value that is determined by local assessors to be the total taxable value of land and additions on the property. | Land | Improvement |
|---|---|---|---|---|
| 2025 | $9,677 | $800,796 | $300,295 | $500,501 |
| 2024 | $9,677 | $785,095 | $294,407 | $490,688 |
| 2023 | $9,463 | $769,702 | $288,635 | $481,067 |
| 2022 | $9,212 | $754,611 | $282,976 | $471,635 |
| 2021 | $9,149 | $739,816 | $277,428 | $462,388 |
| 2020 | $9,038 | $732,231 | $274,584 | $457,647 |
| 2019 | $8,877 | $717,874 | $269,200 | $448,674 |
| 2018 | $8,299 | $703,799 | $263,922 | $439,877 |
| 2017 | $8,102 | $690,000 | $258,748 | $431,252 |
| 2016 | $4,924 | $423,768 | $158,912 | $264,856 |
| 2015 | $4,850 | $417,403 | $156,525 | $260,878 |
| 2014 | $4,773 | $409,227 | $153,459 | $255,768 |
Source: Public Records
Map
Nearby Homes
- 5045 Collwood Way Unit 33
- 4940 Defiance Way
- 4881 Collwood Blvd Unit A
- 4881 Collwood Blvd Unit B
- 4891 Collwood Blvd Unit B
- 5228 Augustana Place
- 4848 54th St
- 5665 Toyon Rd Unit 27
- 5540 Lindo Paseo Unit 19
- 4931 Lorraine Dr
- 4810 Baylor Dr
- 5483 Maisel Way
- 5416 Redland Place
- 4402 Collwood Ln
- 4600 Collwood Ln Unit TR 5772 PAR A
- 4737 Baylor Dr
- 4768 Caroline Dr
- 5556 Baja Dr
- 4704 Austin Dr
- 4664 Yerba Santa Dr
- 5208 Stone Ct
- 5209 Stone Ct
- 5151 College Gardens Ct
- 5161 College Gardens Ct
- 5141 College Gardens Ct
- 5218 Stone Ct
- 5217 Stone Ct
- 5133 College Gardens Ct
- 5234 Stone Ct
- 5181 College Gardens Ct
- 5225 Stone Ct
- 5125 College Gardens Ct
- 5244 Stone Ct
- 5142 College Gardens Ct
- 5233 Stone Ct
- 5162 College Gardens Ct
- 5132 College Gardens Ct
- 5201 College Gardens Ct
- 5241 Stone Ct