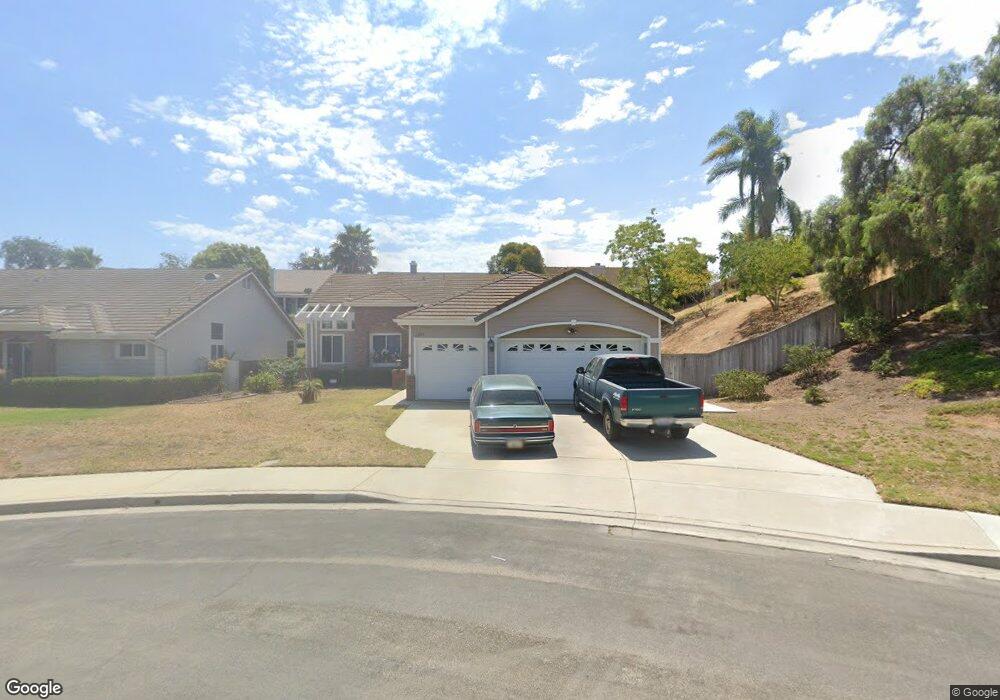
5201 Via Pauma Oceanside, CA 92057
Guajome NeighborhoodEstimated Value: $1,010,000 - $1,104,000
4
Beds
3
Baths
2,605
Sq Ft
$408/Sq Ft
Est. Value
About This Home
This home is located at 5201 Via Pauma, Oceanside, CA 92057 and is currently estimated at $1,062,583, approximately $407 per square foot. 5201 Via Pauma is a home located in San Diego County with nearby schools including Alamosa Park Elementary School, Roosevelt Middle School, and Vista High School.
Ownership History
Date
Name
Owned For
Owner Type
Purchase Details
Closed on
Mar 4, 2025
Sold by
Martin James A
Bought by
James Allen Martin Jr October 2 2024 Trust and Martin
Current Estimated Value
Purchase Details
Closed on
Mar 11, 1998
Sold by
Garrison David A and Garrison Kim E
Bought by
Martin James A and Martin Gloria J
Home Financials for this Owner
Home Financials are based on the most recent Mortgage that was taken out on this home.
Original Mortgage
$218,500
Interest Rate
7%
Mortgage Type
Purchase Money Mortgage
Purchase Details
Closed on
Jan 16, 1996
Sold by
Surrey David A
Bought by
Garrison David A and Garrison Kim E
Home Financials for this Owner
Home Financials are based on the most recent Mortgage that was taken out on this home.
Original Mortgage
$180,500
Interest Rate
7.25%
Mortgage Type
Purchase Money Mortgage
Purchase Details
Closed on
Dec 8, 1995
Sold by
Surrey Teresa M
Bought by
Surrey David A
Home Financials for this Owner
Home Financials are based on the most recent Mortgage that was taken out on this home.
Original Mortgage
$180,500
Interest Rate
7.25%
Mortgage Type
Purchase Money Mortgage
Purchase Details
Closed on
Jun 4, 1991
Create a Home Valuation Report for This Property
The Home Valuation Report is an in-depth analysis detailing your home's value as well as a comparison with similar homes in the area
Home Values in the Area
Average Home Value in this Area
Purchase History
| Date | Buyer | Sale Price | Title Company |
|---|---|---|---|
| James Allen Martin Jr October 2 2024 Trust | -- | None Listed On Document | |
| Martin James A | $230,000 | Old Republic Title Company | |
| Garrison David A | $190,000 | Chicago Title Co | |
| Surrey David A | -- | -- | |
| -- | $197,000 | -- |
Source: Public Records
Mortgage History
| Date | Status | Borrower | Loan Amount |
|---|---|---|---|
| Previous Owner | Martin James A | $218,500 | |
| Previous Owner | Garrison David A | $180,500 |
Source: Public Records
Tax History
| Year | Tax Paid | Tax Assessment Tax Assessment Total Assessment is a certain percentage of the fair market value that is determined by local assessors to be the total taxable value of land and additions on the property. | Land | Improvement |
|---|---|---|---|---|
| 2025 | $3,886 | $367,223 | $86,963 | $280,260 |
| 2024 | $3,886 | $360,023 | $85,258 | $274,765 |
| 2023 | $3,791 | $352,965 | $83,587 | $269,378 |
| 2022 | $3,780 | $346,046 | $81,949 | $264,097 |
| 2021 | $3,695 | $339,262 | $80,343 | $258,919 |
| 2020 | $3,681 | $335,785 | $79,520 | $256,265 |
| 2019 | $3,626 | $329,202 | $77,961 | $251,241 |
| 2018 | $3,446 | $322,748 | $76,433 | $246,315 |
| 2017 | $3,381 | $316,421 | $74,935 | $241,486 |
| 2016 | $3,299 | $310,217 | $73,466 | $236,751 |
| 2015 | $3,285 | $305,558 | $72,363 | $233,195 |
| 2014 | $3,203 | $299,574 | $70,946 | $228,628 |
Source: Public Records
Map
Nearby Homes
- 5010 Golondrina Way Unit 64
- 761 Masters Dr
- 4791 Macadamia Ct
- 4786 Macadamia Ct
- 872 Oro Grande St
- 185 Harrison St
- 4873 Merida Way
- 4877 Merida Way
- 4867 Merida Way
- 4865 Merida Way
- 4891 Merida Way
- 4885 Merida Way
- 4879 Merida Way
- 5524 Giovanni Way
- 255 Flame Tree Place
- 154 Harrison St
- 838 Masters Dr
- 104 Mellano Way
- 5108 Andrew Jackson St
- 5462 Mae Way
- 5205 Via Pauma
- 5168 Via Portola
- 5206 Via Tizon
- 5162 Via Portola
- 5209 Via Pauma
- 5210 Via Tizon
- 5172 Via Portola Unit 2
- 5158 Via Portola
- 368 Luiseno Ave
- 5214 Via Tizon
- 5154 Via Portola
- 364 Luiseno Ave
- 5163 Via Portola
- 5213 Via Pauma
- 5204 Via Pauma
- 5150 Via Portola
- 5167 Via Portola
- 5159 Via Portola
- 5218 Via Tizon
- 5208 Via Pauma
Your Personal Tour Guide
Ask me questions while you tour the home.