Estimated Value: $106,000 - $161,000
1
Bed
1
Bath
720
Sq Ft
$183/Sq Ft
Est. Value
About This Home
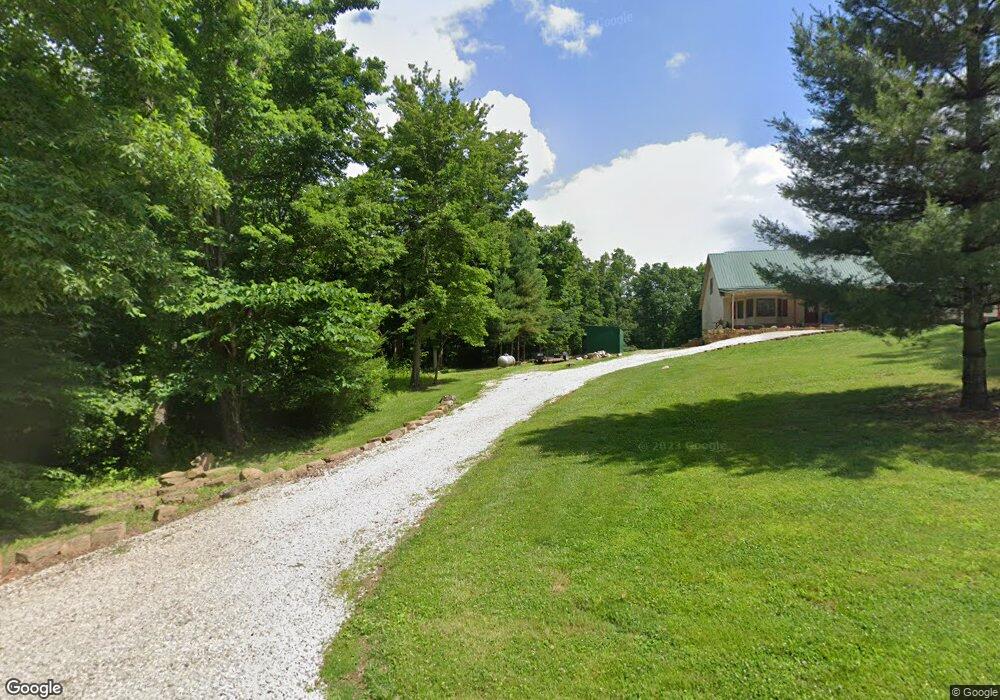
This home is located at 5203 E Borden Rd, Pekin, IN 47165 and is currently estimated at $131,469, approximately $182 per square foot. 5203 E Borden Rd is a home located in Washington County with nearby schools including East Washington Elementary School, East Washington Middle School, and Eastern High School.
Ownership History
Date
Name
Owned For
Owner Type
Purchase Details
Closed on
Aug 15, 2014
Sold by
Taylors Affordable Floors Llc
Bought by
Whitaker B Wayne
Current Estimated Value
Purchase Details
Closed on
Oct 13, 2011
Sold by
Federal Home Loan Mortgage Corporation
Bought by
Atylors Affordable Floors Llc
Purchase Details
Closed on
Jun 27, 2011
Sold by
Bunch Ashley R and Gmac Mortgage Llc
Bought by
Federal Home Loan Mortgage Corporation
Purchase Details
Closed on
Aug 11, 2006
Sold by
Oxley Adam
Bought by
Bunch Ashley R
Purchase Details
Closed on
Jun 28, 2005
Sold by
Miller Michael S
Bought by
Oxley Adam
Home Financials for this Owner
Home Financials are based on the most recent Mortgage that was taken out on this home.
Original Mortgage
$10,580
Interest Rate
5.86%
Mortgage Type
Credit Line Revolving
Create a Home Valuation Report for This Property
The Home Valuation Report is an in-depth analysis detailing your home's value as well as a comparison with similar homes in the area
Home Values in the Area
Average Home Value in this Area
Purchase History
| Date | Buyer | Sale Price | Title Company |
|---|---|---|---|
| Whitaker B Wayne | -- | None Available | |
| Atylors Affordable Floors Llc | -- | None Available | |
| Federal Home Loan Mortgage Corporation | -- | None Available | |
| Bunch Ashley R | -- | None Available | |
| Oxley Adam | -- | None Available |
Source: Public Records
Mortgage History
| Date | Status | Borrower | Loan Amount |
|---|---|---|---|
| Previous Owner | Oxley Adam | $10,580 |
Source: Public Records
Tax History Compared to Growth
Tax History
| Year | Tax Paid | Tax Assessment Tax Assessment Total Assessment is a certain percentage of the fair market value that is determined by local assessors to be the total taxable value of land and additions on the property. | Land | Improvement |
|---|---|---|---|---|
| 2024 | $276 | $59,100 | $12,800 | $46,300 |
| 2023 | $291 | $56,100 | $12,800 | $43,300 |
| 2022 | $307 | $52,100 | $12,800 | $39,300 |
| 2021 | $294 | $47,800 | $12,800 | $35,000 |
| 2020 | $287 | $46,300 | $12,800 | $33,500 |
| 2019 | $263 | $42,800 | $12,800 | $30,000 |
| 2018 | $243 | $40,300 | $12,800 | $27,500 |
| 2017 | $225 | $43,900 | $12,800 | $31,100 |
| 2016 | $189 | $41,100 | $12,800 | $28,300 |
| 2014 | $178 | $39,800 | $12,800 | $27,000 |
| 2013 | $159 | $38,000 | $12,800 | $25,200 |
Source: Public Records
Map
Nearby Homes
- 9916 S Voyles Rd
- 10484 S State Road 335
- 11798 S Priddy Rd
- 9927 Maplewood Ct
- 9320 Pekin Rd
- 6872 E Hurst Rd
- off E Hurst Rd
- 0 E Hurst Rd
- off S Side Buffalo Trace Rd
- off W Side Buffalo Trace Rd
- 8369 S Old Palmyra Rd
- 8185 Pekin Rd
- 530 E Main St
- 520 E Main St
- 0 Coffman Rd
- 341 S 3rd St
- 7651 S Old Palmyra Rd
- 8194 Borden Rd
- 11409 Highway 150
- 800 N Blue River Rd
- 5135 E Borden Rd
- 5121 E Borden Rd
- 5209 E Borden Rd
- 11142 S Trinity Ln
- 5071 E Borden Rd
- 11145 S Trinity Ln
- 5211 E Borden Rd
- 0 Trinity Ln
- 11098 S Trinity Ln
- 5286 E Borden Rd
- 5056 E Borden Rd
- 5379 E Borden Rd
- 4993 E Borden Rd
- 5339 E Borden Rd
- 4964 E Borden Rd
- 11087 S Trinity Ln
- 5368 E Borden Rd
- 5449 E Borden Rd
- 4928 E Mann Rd
- 5416 E Borden Rd