J
Seller's Agent in 2022
Jason Gunsorek
Real Estate Opportunity
(614) 501-4444
3 in this area
16 Total Sales

Estimated Value: $168,000 - $188,000
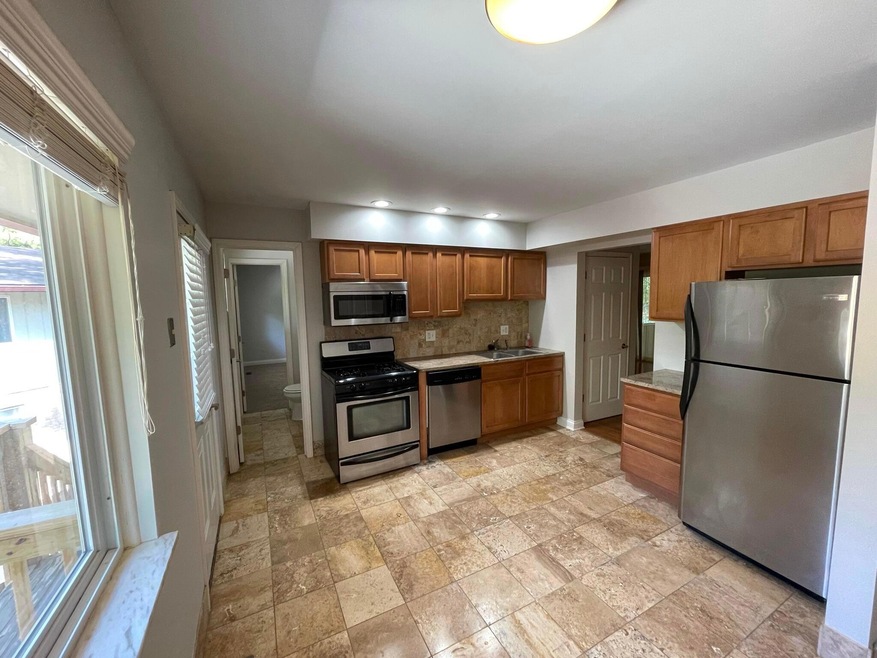
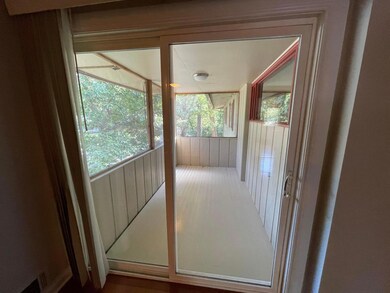
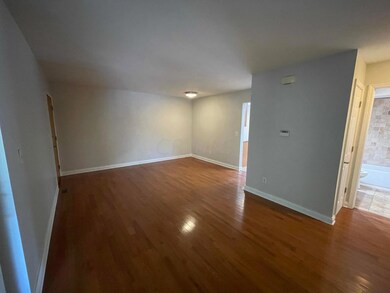
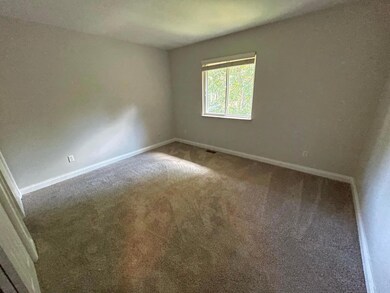
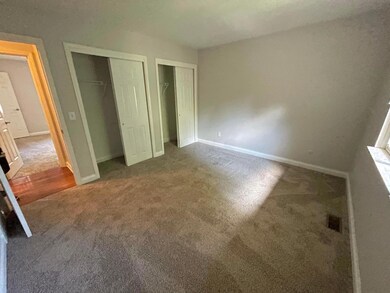
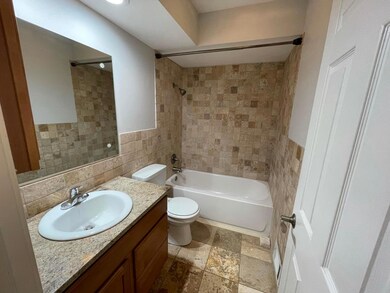
Don't miss this great 2nd floor unit in Fenway Pines! The unit has a garage and a private entrance into the kitchen from the garage. Features include a large screened in porch, hardwood floors in the living area, new carpet in the bedrooms, new paint, travertine tile in the kitchen and bathrooms, and in-unit laundry hookup. One of only a few units with 1.5 baths! The unit includes a large storage locker in the basement. Agent related to Member of Selling Entity
Last Agent to Sell the Property
Real Estate Opportunity License #2002022402 Listed on: 09/28/2021
| Date | Buyer | Sale Price | Title Company |
|---|---|---|---|
| Girard Tyler Joseph | $144,000 | Valmer Land Title | |
| Girard Tyler Joseph | $144,000 | Valmer Land Title |
| Date | Status | Borrower | Loan Amount |
|---|---|---|---|
| Open | Girard Tyler Joseph | $139,440 | |
| Closed | Girard Tyler Joseph | $139,440 |
| Date | Event | Price | List to Sale | Price per Sq Ft |
|---|---|---|---|---|
| 04/04/2022 04/04/22 | Sold | $144,000 | -3.9% | $151 / Sq Ft |
| 02/14/2022 02/14/22 | Pending | -- | -- | -- |
| 09/28/2021 09/28/21 | For Sale | $149,900 | -- | $157 / Sq Ft |
| Year | Tax Paid | Tax Assessment Tax Assessment Total Assessment is a certain percentage of the fair market value that is determined by local assessors to be the total taxable value of land and additions on the property. | Land | Improvement |
|---|---|---|---|---|
| 2024 | $2,246 | $50,050 | $43,750 | $6,300 |
| 2023 | $2,218 | $50,050 | $43,750 | $6,300 |
| 2022 | $2,210 | $41,580 | $6,720 | $34,860 |
| 2021 | $2,214 | $41,580 | $6,720 | $34,860 |
| 2020 | $2,217 | $41,580 | $6,720 | $34,860 |
| 2019 | $2,155 | $34,650 | $5,600 | $29,050 |
| 2018 | $1,675 | $34,650 | $5,600 | $29,050 |
| 2017 | $2,154 | $34,650 | $5,600 | $29,050 |
| 2016 | $1,317 | $19,390 | $5,950 | $13,440 |
| 2015 | $1,199 | $19,390 | $5,950 | $13,440 |
| 2014 | $1,202 | $19,390 | $5,950 | $13,440 |
| 2013 | $1,006 | $32,900 | $5,950 | $26,950 |
J
Seller's Agent in 2022
Jason Gunsorek
Real Estate Opportunity
(614) 501-4444
3 in this area
16 Total Sales

Buyer's Agent in 2022
Lynnette Girard
NextHome Experience
(614) 506-4619
4 in this area
110 Total Sales
Source: Columbus and Central Ohio Regional MLS
MLS Number: 221038119
APN: 010-280500
Disclaimer: Certain information contained herein is derived from information provided by parties other than Homes.com. All information provided is deemed reliable, but is not guaranteed to be accurate and should be independently verified.
![]() IDX information is provided exclusively for personal, non-commercial use, and may not be used for any purpose other than to identify prospective properties consumers may be interested in purchasing.
IDX information is provided exclusively for personal, non-commercial use, and may not be used for any purpose other than to identify prospective properties consumers may be interested in purchasing.
Information is deemed reliable but not guaranteed.