5204 Clayton Ct La Verne, CA 91750
Estimated Value: $2,147,000 - $4,862,000
6
Beds
6
Baths
10,194
Sq Ft
$333/Sq Ft
Est. Value
About This Home
This home is located at 5204 Clayton Ct, La Verne, CA 91750 and is currently estimated at $3,392,971, approximately $332 per square foot. 5204 Clayton Ct is a home located in Los Angeles County with nearby schools including Sumner Elementary School, El Roble Intermediate School, and Claremont High School.
Ownership History
Date
Name
Owned For
Owner Type
Purchase Details
Closed on
Apr 12, 2025
Sold by
Wang Jim Juaian and Olive Wenfeng
Bought by
Wang Olive Wenfeng
Current Estimated Value
Purchase Details
Closed on
Feb 26, 2010
Sold by
Nalbach Robert Daniel
Bought by
Wang Jim Juaian
Home Financials for this Owner
Home Financials are based on the most recent Mortgage that was taken out on this home.
Original Mortgage
$1,430,000
Interest Rate
4.94%
Mortgage Type
New Conventional
Purchase Details
Closed on
Sep 10, 2002
Sold by
Nalbach Robert Daniel
Bought by
Nalbach Robert Daniel
Home Financials for this Owner
Home Financials are based on the most recent Mortgage that was taken out on this home.
Original Mortgage
$760,000
Interest Rate
6.24%
Purchase Details
Closed on
Oct 22, 2001
Sold by
Nalbach Aileen M
Bought by
Nalbach Robert Daniel
Purchase Details
Closed on
Jan 28, 1998
Sold by
Nalbach Robert Daniel and Nalbach Aileen Marie
Bought by
Nalbach Robert D
Home Financials for this Owner
Home Financials are based on the most recent Mortgage that was taken out on this home.
Original Mortgage
$725,000
Interest Rate
7.05%
Purchase Details
Closed on
May 1, 1995
Sold by
J C C Homes
Bought by
Nalbach Dr Robert Daniel and Nalbach Aileen Marie
Home Financials for this Owner
Home Financials are based on the most recent Mortgage that was taken out on this home.
Original Mortgage
$800,000
Interest Rate
7.92%
Mortgage Type
Seller Take Back
Purchase Details
Closed on
Feb 23, 1995
Sold by
Pieratt Anita
Bought by
J C C Homes
Home Financials for this Owner
Home Financials are based on the most recent Mortgage that was taken out on this home.
Original Mortgage
$588,000
Interest Rate
9.09%
Purchase Details
Closed on
Nov 23, 1994
Sold by
Gomberg Harvey
Bought by
Pieratt Anita
Purchase Details
Closed on
Sep 2, 1994
Sold by
Sierra View Partnership
Bought by
J C C Homes
Home Financials for this Owner
Home Financials are based on the most recent Mortgage that was taken out on this home.
Original Mortgage
$110,000
Interest Rate
8.58%
Mortgage Type
Seller Take Back
Purchase Details
Closed on
Aug 17, 1994
Sold by
J C C Homes
Bought by
Pieratt Anita
Home Financials for this Owner
Home Financials are based on the most recent Mortgage that was taken out on this home.
Original Mortgage
$110,000
Interest Rate
8.58%
Mortgage Type
Seller Take Back
Create a Home Valuation Report for This Property
The Home Valuation Report is an in-depth analysis detailing your home's value as well as a comparison with similar homes in the area
Home Values in the Area
Average Home Value in this Area
Purchase History
| Date | Buyer | Sale Price | Title Company |
|---|---|---|---|
| Wang Olive Wenfeng | -- | None Listed On Document | |
| Wang Jim Juaian | $2,200,000 | Fidelity National Title | |
| Nalbach Robert Daniel | -- | Ticor Title | |
| Nalbach Robert Daniel | -- | -- | |
| Nalbach Robert D | -- | Fidelity National Title Ins | |
| Nalbach Dr Robert Daniel | $327,000 | Stewart Title | |
| J C C Homes | -- | Stewart Title | |
| Pieratt Anita | -- | Stewart Title | |
| J C C Homes | $205,000 | Investors Title Company | |
| Pieratt Anita | -- | Stewart Title |
Source: Public Records
Mortgage History
| Date | Status | Borrower | Loan Amount |
|---|---|---|---|
| Previous Owner | Wang Jim Juaian | $1,430,000 | |
| Previous Owner | Nalbach Robert Daniel | $760,000 | |
| Previous Owner | Nalbach Robert D | $725,000 | |
| Previous Owner | Nalbach Dr Robert Daniel | $800,000 | |
| Previous Owner | J C C Homes | $588,000 | |
| Previous Owner | J C C Homes | $110,000 | |
| Previous Owner | Pieratt Anita | $750,000 |
Source: Public Records
Tax History Compared to Growth
Tax History
| Year | Tax Paid | Tax Assessment Tax Assessment Total Assessment is a certain percentage of the fair market value that is determined by local assessors to be the total taxable value of land and additions on the property. | Land | Improvement |
|---|---|---|---|---|
| 2025 | $32,981 | $2,839,799 | $1,091,516 | $1,748,283 |
| 2024 | $32,981 | $2,784,117 | $1,070,114 | $1,714,003 |
| 2023 | $32,224 | $2,729,528 | $1,049,132 | $1,680,396 |
| 2022 | $31,706 | $2,676,009 | $1,028,561 | $1,647,448 |
| 2021 | $31,238 | $2,623,540 | $1,008,394 | $1,615,146 |
| 2019 | $29,774 | $2,545,727 | $978,486 | $1,567,241 |
| 2018 | $28,851 | $2,495,811 | $959,300 | $1,536,511 |
| 2016 | $26,848 | $2,398,898 | $922,050 | $1,476,848 |
| 2015 | $26,363 | $2,362,865 | $908,200 | $1,454,665 |
| 2014 | $26,113 | $2,316,581 | $890,410 | $1,426,171 |
Source: Public Records
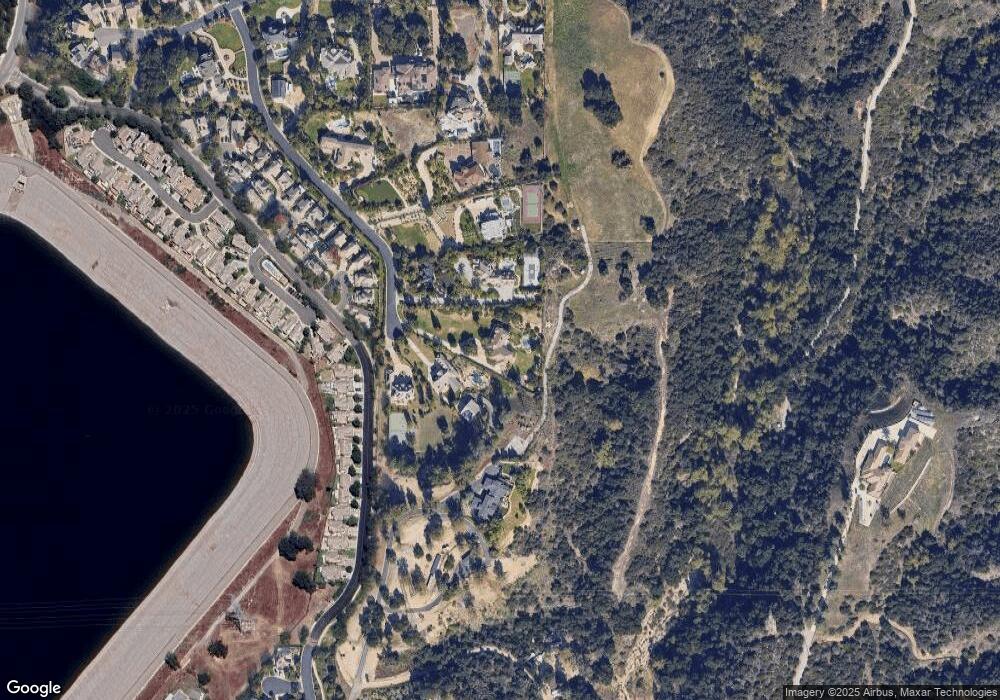
Map
Nearby Homes
- 3231 Barn Owl
- 2986 Falconberg Dr
- 2698 Peacock Place
- 2543 Sloan Dr
- 0 Live Oak Canyon Rd Unit CV24240773
- 5793 Prairie Falcon Dr
- 160 Summit Rd
- 5795 Blackbird Ln
- 2463 Abadejo
- 16 Esperanza Dr Unit 16
- 251 Summit Rd
- 4710 Williams Ave
- 2564 Lunes
- 888 W Highpoint Dr
- 350 Roughrider Rd
- 2637 N Mountain Ave
- 0 Briney Point Rd Unit IV25031181
- 4485 Broken Spur Rd
- 0 Broken Spur Rd
- 6237 Birdie Dr
- 5202 Clayton Ct Unit 1
- 5202 Clayton Ct
- 5212 Clayton Ct
- 5200 Clayton Ct
- 5240 Clayton Ct
- 3212 Thrush Place
- 3222 Thrush Place
- 5120 Live Oak Canyon Rd
- 3228 Thrush Place
- 6675 Shemiran St
- 3232 Thrush Place
- 6663 Shemiran St
- 6687 Shemiran St
- 6651 Shemiran St
- 6641 Shemiran St
- 6701 Blue Heron Place
- 3231 Thrush Place
- 3231 Thrush Place
- 6629 Shemiran St
- 5242 Clayton Ct