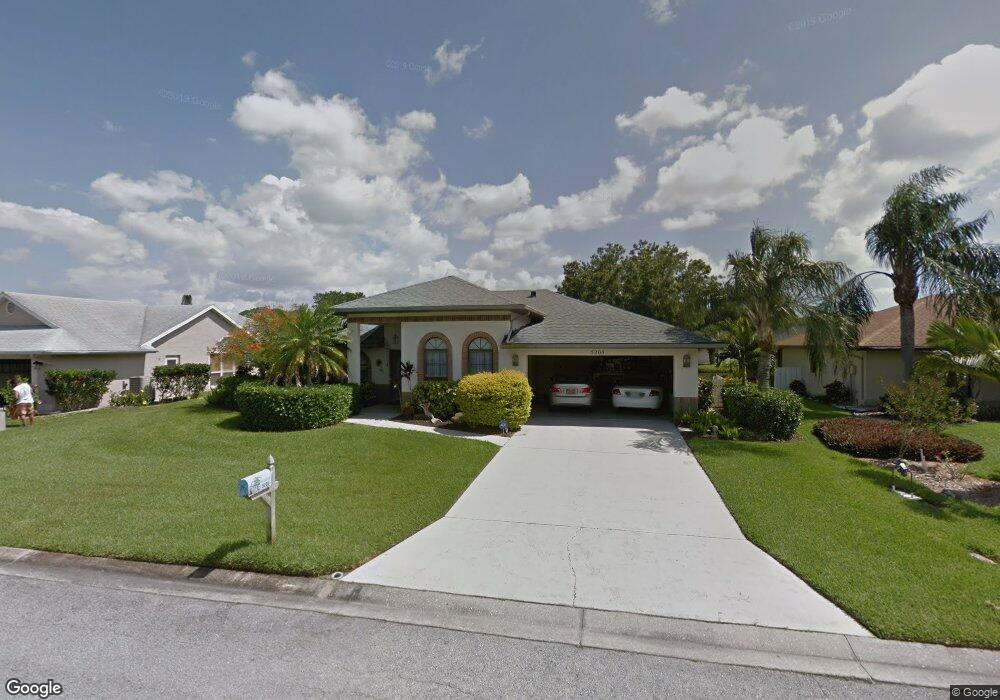
5205 19th Ave W Bradenton, FL 34209
West Bradenton NeighborhoodEstimated Value: $563,157 - $623,000
3
Beds
2
Baths
2,210
Sq Ft
$268/Sq Ft
Est. Value
About This Home
This home is located at 5205 19th Ave W, Bradenton, FL 34209 and is currently estimated at $593,039, approximately $268 per square foot. 5205 19th Ave W is a home located in Manatee County with nearby schools including Palma Sola Elementary School, W. D. Sugg Middle School, and Manatee High School.
Ownership History
Date
Name
Owned For
Owner Type
Purchase Details
Closed on
Oct 25, 2011
Sold by
Carloni Sharon M
Bought by
Carloni Edmund R and Carloni Sharon M
Current Estimated Value
Purchase Details
Closed on
May 20, 2011
Sold by
Valley Michael R
Bought by
Carloni Sharon M
Purchase Details
Closed on
Nov 4, 2010
Sold by
Valley Wendy S
Bought by
Valley Michael R
Purchase Details
Closed on
Feb 14, 2002
Sold by
Kramer Aaron J and Kramer Laura H
Bought by
Valley Michael R and Valley Wendy S
Home Financials for this Owner
Home Financials are based on the most recent Mortgage that was taken out on this home.
Original Mortgage
$155,120
Interest Rate
7.02%
Purchase Details
Closed on
Mar 29, 1996
Sold by
Zimmerman Donald I
Bought by
Kramer Aaron J and Kramer Laura H
Home Financials for this Owner
Home Financials are based on the most recent Mortgage that was taken out on this home.
Original Mortgage
$145,350
Interest Rate
6.9%
Create a Home Valuation Report for This Property
The Home Valuation Report is an in-depth analysis detailing your home's value as well as a comparison with similar homes in the area
Home Values in the Area
Average Home Value in this Area
Purchase History
| Date | Buyer | Sale Price | Title Company |
|---|---|---|---|
| Carloni Edmund R | -- | Attorney | |
| Carloni Sharon M | $209,900 | Barnes Walker Title Inc | |
| Valley Michael R | -- | Barnes Walker Title Inc | |
| Valley Michael R | $193,900 | -- | |
| Kramer Aaron J | $161,500 | -- |
Source: Public Records
Mortgage History
| Date | Status | Borrower | Loan Amount |
|---|---|---|---|
| Previous Owner | Valley Michael R | $155,120 | |
| Previous Owner | Kramer Aaron J | $145,350 |
Source: Public Records
Tax History
| Year | Tax Paid | Tax Assessment Tax Assessment Total Assessment is a certain percentage of the fair market value that is determined by local assessors to be the total taxable value of land and additions on the property. | Land | Improvement |
|---|---|---|---|---|
| 2025 | $3,795 | $292,231 | -- | -- |
| 2023 | $3,729 | $275,723 | $0 | $0 |
| 2022 | $3,630 | $267,692 | $0 | $0 |
| 2021 | $3,480 | $259,895 | $0 | $0 |
| 2020 | $3,584 | $256,307 | $0 | $0 |
| 2019 | $3,529 | $250,544 | $0 | $0 |
| 2018 | $3,500 | $245,872 | $0 | $0 |
| 2017 | $3,258 | $240,815 | $0 | $0 |
| 2016 | $3,251 | $235,862 | $0 | $0 |
Source: Public Records
Map
Nearby Homes
- 5102 19th Ave W
- 5307 18th Ave W
- 2207 51st St W
- 5060 18th Ave W
- 2003 49th St W
- 1812 48th St W
- 5112 26th Ave W
- 1487 56th St W Unit 1487
- 5311 14th Avenue Dr W
- 1454 56th St W Unit 1454
- 1446 56th St W Unit 1446
- 4704 18th Ave W
- 1435 57th St W Unit 1435
- 1431 57th St W Unit 1431
- 4811 26th Ave W
- 1421 57th St W Unit 1421
- 4904 27th Ave W
- 2506 Songbird Ln Unit 46
- 1304 56th St W Unit 1304
- 1225 56th St W Unit 1225
- 5209 19th Ave W
- 5201 19th Ave W
- 5206 20th Ave W
- 5301 19th Ave W
- 5210 20th Ave W
- 5202 20th Ave W
- 5210 19th Ave W
- 5202 19th Ave W
- 5304 20th Ave W
- 5116 20th Ave W
- 5305 19th Ave W
- 5109 19th Ave W
- 5114 19th Ave W
- 5112 20th Ave W
- 1925 54th St W
- 5207 18th Avenue Dr W
- 5308 20th Ave W
- 5215 18th Avenue Dr W
- 5309 19th Ave W
- 5215 18th Avenue Dr W
Your Personal Tour Guide
Ask me questions while you tour the home.