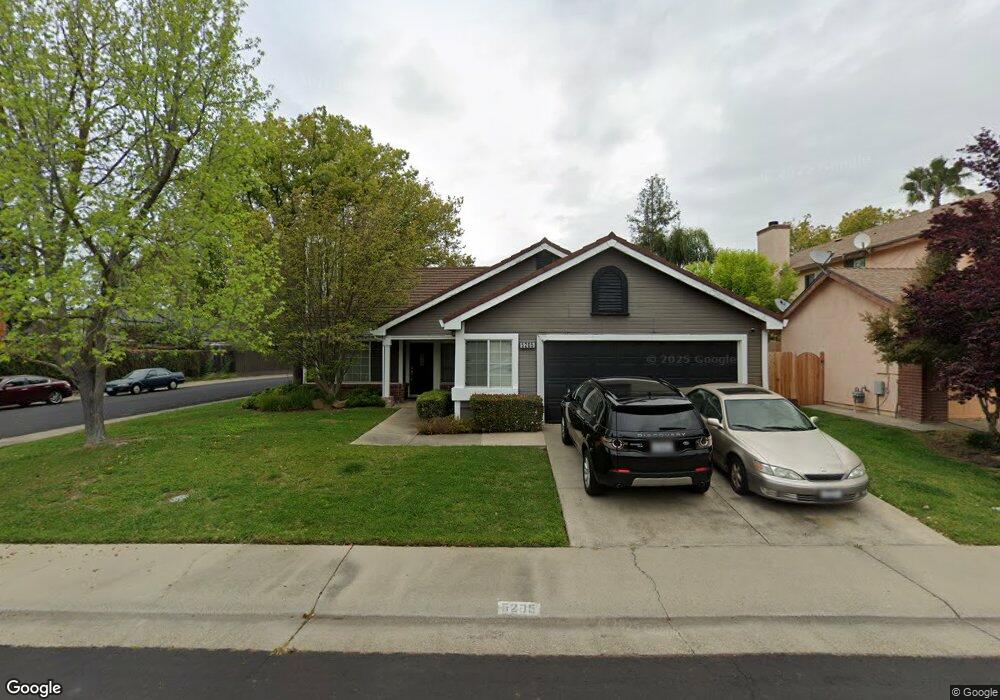
5205 Applehurst Way Elk Grove, CA 95758
North West Elk Grove NeighborhoodEstimated Value: $433,000 - $526,075
4
Beds
2
Baths
1,486
Sq Ft
$334/Sq Ft
Est. Value
About This Home
This home is located at 5205 Applehurst Way, Elk Grove, CA 95758 and is currently estimated at $496,019, approximately $333 per square foot. 5205 Applehurst Way is a home located in Sacramento County with nearby schools including Marion Mix Elementary School, Harriet G. Eddy Middle School, and Laguna Creek High School.
Ownership History
Date
Name
Owned For
Owner Type
Purchase Details
Closed on
Sep 19, 2024
Sold by
West Kimberly J and Thompson Kimberly J
Bought by
West Brandon E and Thompson Kimberly J
Current Estimated Value
Home Financials for this Owner
Home Financials are based on the most recent Mortgage that was taken out on this home.
Original Mortgage
$290,000
Outstanding Balance
$286,459
Interest Rate
6.47%
Mortgage Type
New Conventional
Estimated Equity
$209,560
Purchase Details
Closed on
Dec 20, 2004
Sold by
Parsons Jeanette T and Parson Jeanette T
Bought by
Parsons Jeanette T and Parsons Revocable L Jeanette T
Purchase Details
Closed on
Sep 15, 1997
Sold by
West Kimberly J and West Jeanette T
Bought by
West Kimberly J and Parson Jeanette T
Home Financials for this Owner
Home Financials are based on the most recent Mortgage that was taken out on this home.
Original Mortgage
$96,809
Interest Rate
7.45%
Mortgage Type
FHA
Create a Home Valuation Report for This Property
The Home Valuation Report is an in-depth analysis detailing your home's value as well as a comparison with similar homes in the area
Home Values in the Area
Average Home Value in this Area
Purchase History
| Date | Buyer | Sale Price | Title Company |
|---|---|---|---|
| West Brandon E | -- | Chicago Title | |
| Thompson Kimberly J | $207,000 | Chicago Title | |
| Parsons Jeanette T | -- | -- | |
| West Kimberly J | -- | Chicago Title Co |
Source: Public Records
Mortgage History
| Date | Status | Borrower | Loan Amount |
|---|---|---|---|
| Open | Thompson Kimberly J | $290,000 | |
| Previous Owner | West Kimberly J | $96,809 |
Source: Public Records
Tax History Compared to Growth
Tax History
| Year | Tax Paid | Tax Assessment Tax Assessment Total Assessment is a certain percentage of the fair market value that is determined by local assessors to be the total taxable value of land and additions on the property. | Land | Improvement |
|---|---|---|---|---|
| 2025 | $4,489 | $365,198 | $85,943 | $279,255 |
| 2024 | $4,489 | $358,533 | $86,734 | $271,799 |
| 2023 | $2,361 | $185,720 | $46,485 | $139,235 |
| 2022 | $2,323 | $182,079 | $45,574 | $136,505 |
| 2021 | $2,267 | $178,510 | $44,681 | $133,829 |
| 2020 | $2,233 | $176,680 | $44,223 | $132,457 |
| 2019 | $2,188 | $173,216 | $43,356 | $129,860 |
| 2018 | $2,131 | $169,820 | $42,506 | $127,314 |
| 2017 | $2,087 | $166,491 | $41,673 | $124,818 |
| 2016 | $4,222 | $163,227 | $40,856 | $122,371 |
| 2015 | $1,958 | $160,776 | $40,243 | $120,533 |
| 2014 | $2,528 | $157,627 | $39,455 | $118,172 |
Source: Public Records
Map
Nearby Homes
- 5310 Privet Ln
- 8959 Boreal Way
- 0 Elliott Ranch Rd Unit 225131105
- 5013 Efthemia Way
- 8741 Noble Fir Ln
- Residence 2125 Plan at Tegan Estates
- Residence 1845 Plan at Tegan Estates
- Residence 1960 Plan at Tegan Estates
- Residence 1850 Plan at Tegan Estates
- 8944 Warmsprings St
- 5161 Saint Edwards Way
- 4910 Harrow Dr
- 9105 Turnbull Ct
- 6024 Deepdale Way
- 9121 Hensley Way
- 9139 Hensley Way
- 9144 Hensley Way
- 9186 Jamel Ct
- 1312 Winterhart St
- 6131 Jacinto Ave
- 5209 Applehurst Way
- 5113 Beechurst Ct
- 5130 Olivehurst Way
- 5213 Applehurst Way
- 5134 Olivehurst Way
- 5204 Applehurst Way
- 5116 Ashurst Ct
- 5208 Applehurst Way
- 5200 Applehurst Way
- 5109 Beechurst Ct
- 5138 Olivehurst Way
- 5217 Applehurst Way
- 5212 Applehurst Way
- 5112 Beechurst Ct
- 5112 Ashurst Ct
- 5216 Applehurst Way
- 5105 Beechurst Ct
- 5142 Olivehurst Way
- 5108 Beechurst Ct
- 5221 Applehurst Way