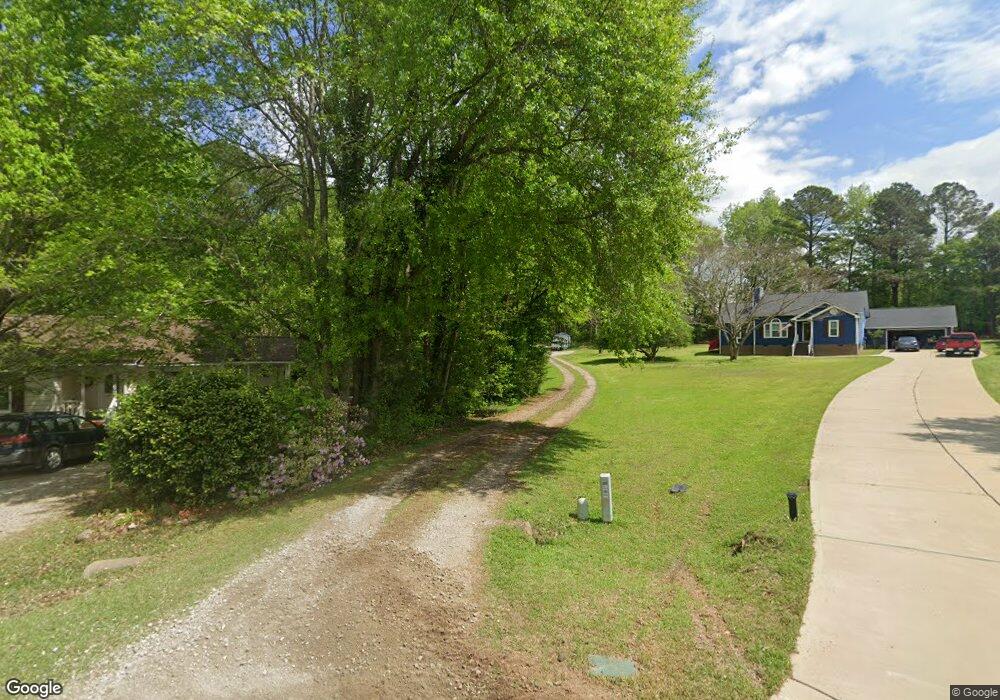
5205 Carrier Way Raleigh, NC 27603
Estimated Value: $318,000 - $335,954
3
Beds
2
Baths
1,250
Sq Ft
$262/Sq Ft
Est. Value
About This Home
This home is located at 5205 Carrier Way, Raleigh, NC 27603 and is currently estimated at $327,989, approximately $262 per square foot. 5205 Carrier Way is a home located in Wake County with nearby schools including Vance Elementary School, North Garner Middle, and Garner High.
Ownership History
Date
Name
Owned For
Owner Type
Purchase Details
Closed on
Jun 28, 2011
Sold by
Singletary Christopher M and Singletary Nicola V K
Bought by
Baxley Stacy R
Current Estimated Value
Home Financials for this Owner
Home Financials are based on the most recent Mortgage that was taken out on this home.
Original Mortgage
$118,500
Outstanding Balance
$81,985
Interest Rate
4.63%
Mortgage Type
New Conventional
Estimated Equity
$246,004
Purchase Details
Closed on
May 2, 2001
Sold by
Hud
Bought by
Singletary Christopher M and Vyborny Nicola V K
Home Financials for this Owner
Home Financials are based on the most recent Mortgage that was taken out on this home.
Original Mortgage
$83,700
Interest Rate
6.9%
Purchase Details
Closed on
Oct 3, 2000
Sold by
Workman Michael W
Bought by
Hud
Create a Home Valuation Report for This Property
The Home Valuation Report is an in-depth analysis detailing your home's value as well as a comparison with similar homes in the area
Home Values in the Area
Average Home Value in this Area
Purchase History
| Date | Buyer | Sale Price | Title Company |
|---|---|---|---|
| Baxley Stacy R | $120,000 | None Available | |
| Singletary Christopher M | -- | -- | |
| Hud | $95,149 | -- |
Source: Public Records
Mortgage History
| Date | Status | Borrower | Loan Amount |
|---|---|---|---|
| Open | Baxley Stacy R | $118,500 | |
| Previous Owner | Singletary Christopher M | $83,700 |
Source: Public Records
Tax History Compared to Growth
Tax History
| Year | Tax Paid | Tax Assessment Tax Assessment Total Assessment is a certain percentage of the fair market value that is determined by local assessors to be the total taxable value of land and additions on the property. | Land | Improvement |
|---|---|---|---|---|
| 2025 | $1,896 | $293,265 | $120,000 | $173,265 |
| 2024 | $1,841 | $293,265 | $120,000 | $173,265 |
| 2023 | $1,471 | $186,120 | $50,000 | $136,120 |
| 2022 | $1,364 | $186,120 | $50,000 | $136,120 |
| 2021 | $1,328 | $186,120 | $50,000 | $136,120 |
| 2020 | $1,306 | $186,120 | $50,000 | $136,120 |
| 2019 | $1,130 | $135,898 | $40,000 | $95,898 |
| 2018 | $1,040 | $135,898 | $40,000 | $95,898 |
| 2017 | $986 | $135,898 | $40,000 | $95,898 |
| 2016 | $967 | $135,898 | $40,000 | $95,898 |
| 2015 | $915 | $128,923 | $34,000 | $94,923 |
| 2014 | $868 | $128,923 | $34,000 | $94,923 |
Source: Public Records
Map
Nearby Homes
- 2704 Stageline Dr
- 2600 Banks Rd Unit Lot 2
- 2600 Banks Rd Unit Lot 1
- 2712 Quail Point Dr
- 5232 Passenger Place
- 2817 Buckboard Ln
- 2400 Trueway Ln
- 5512 Glenhurst Dr N
- 5057 Trotter Dr
- 10329 Fanny Brown Rd
- 5060 Trotter Dr
- 5712 Turner Store Ln
- 4824 Bristol Meadow Dr
- The Beech Plan at Laneridge Estates
- The Crawford Plan at Laneridge Estates
- 1329 Wynncrest Ct
- 449 Kings Hollow Dr
- 1005 Turner Meadow Dr
- 5000 Trotter Dr
- 5040 Trotter Dr
- 5209 Carrier Way
- 5201 Carrier Way
- 5213 Carrier Way
- 5200 Carrier Way
- 5217 Carrier Way
- 5216 Carrier Way
- 5221 Carrier Way
- 5225 Carrier Way
- 5224 Carrier Way
- 2517 Banks Rd
- 10213 Old Stage Rd
- 2700 Stageline Dr
- 2720 Stageline Dr
- 10301 Old Stage Rd
- 2477 Stageline Dr
- 2724 Stageline Dr
- 2716 Stageline Dr
- 2601 Banks Rd
- 5112 Rock Service Station Rd
- 2607 Banks Rd