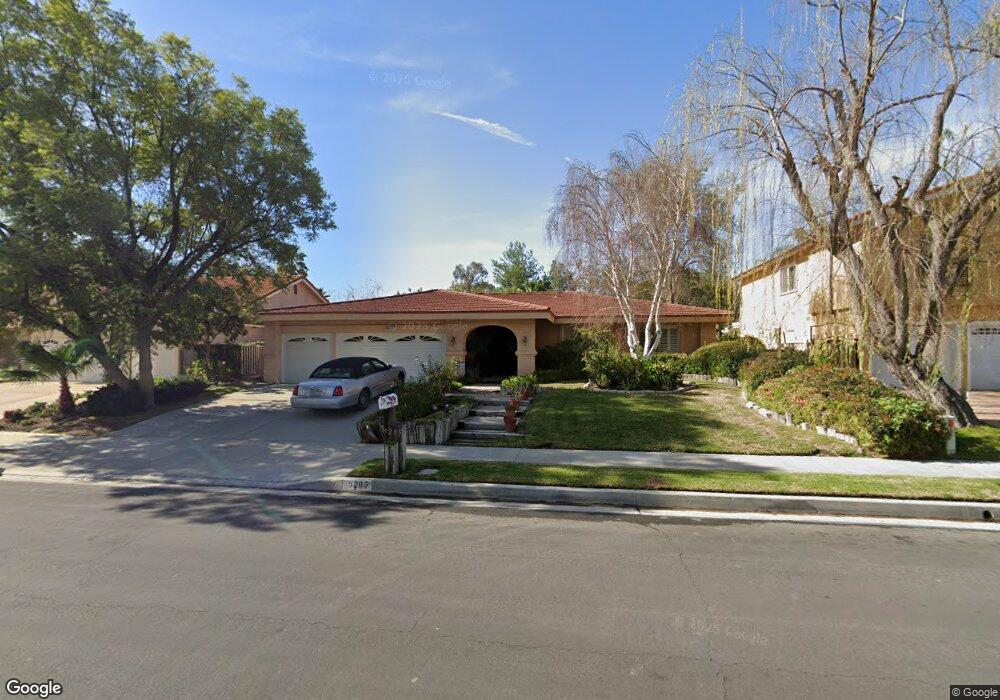
5205 Orrville Ave Woodland Hills, CA 91367
Estimated Value: $1,555,097 - $1,829,000
4
Beds
3
Baths
2,417
Sq Ft
$713/Sq Ft
Est. Value
About This Home
This home is located at 5205 Orrville Ave, Woodland Hills, CA 91367 and is currently estimated at $1,723,024, approximately $712 per square foot. 5205 Orrville Ave is a home located in Los Angeles County with nearby schools including Woodlake Elementary Community Charter, Lockhurst Drive Charter Elementary, and Haynes Charter For Enriched Studies.
Ownership History
Date
Name
Owned For
Owner Type
Purchase Details
Closed on
Jun 19, 1997
Sold by
Davidson Harvey Steve and Davidson Marcy
Bought by
Davidson Harvey Steven
Current Estimated Value
Purchase Details
Closed on
Apr 20, 1995
Sold by
Transamerica Financial Services
Bought by
Davidson Harvey Steve
Home Financials for this Owner
Home Financials are based on the most recent Mortgage that was taken out on this home.
Original Mortgage
$203,000
Interest Rate
7%
Purchase Details
Closed on
Aug 10, 1994
Sold by
Levy Amicam and Levy Rose
Bought by
Transamerica Financial Services
Purchase Details
Closed on
Jan 15, 1994
Sold by
Sun Springs Marinas Inc
Bought by
5437 Virginia Ave Partnership
Purchase Details
Closed on
May 2, 1993
Sold by
Levy Rose
Bought by
Sun Springs Marinas
Create a Home Valuation Report for This Property
The Home Valuation Report is an in-depth analysis detailing your home's value as well as a comparison with similar homes in the area
Home Values in the Area
Average Home Value in this Area
Purchase History
| Date | Buyer | Sale Price | Title Company |
|---|---|---|---|
| Davidson Harvey Steven | -- | -- | |
| Davidson Harvey Steve | $261,000 | Fidelity National Title Ins | |
| Transamerica Financial Services | $235,851 | Benevest Title | |
| 5437 Virginia Ave Partnership | -- | -- | |
| Sun Springs Marinas | -- | -- |
Source: Public Records
Mortgage History
| Date | Status | Borrower | Loan Amount |
|---|---|---|---|
| Closed | Davidson Harvey Steve | $203,000 |
Source: Public Records
Tax History Compared to Growth
Tax History
| Year | Tax Paid | Tax Assessment Tax Assessment Total Assessment is a certain percentage of the fair market value that is determined by local assessors to be the total taxable value of land and additions on the property. | Land | Improvement |
|---|---|---|---|---|
| 2025 | $5,582 | $438,373 | $228,592 | $209,781 |
| 2024 | $5,582 | $429,778 | $224,110 | $205,668 |
| 2023 | $5,480 | $421,352 | $219,716 | $201,636 |
| 2022 | $5,236 | $413,091 | $215,408 | $197,683 |
| 2021 | $5,162 | $404,992 | $211,185 | $193,807 |
| 2019 | $5,013 | $392,981 | $204,922 | $188,059 |
| 2018 | $4,872 | $385,276 | $200,904 | $184,372 |
| 2016 | $4,638 | $370,316 | $193,103 | $177,213 |
| 2015 | $4,572 | $364,755 | $190,203 | $174,552 |
| 2014 | $4,594 | $357,611 | $186,478 | $171,133 |
Source: Public Records
Map
Nearby Homes
- 5547 Paradise Valley Rd
- 23761 Ladrillo St
- 5546 Paradise Valley Rd
- 5320 Orrville Ave
- 23623 Ladrillo St
- 23721 Mariano St
- 23701 Clarendon St
- 23621 Long Valley Rd
- 24024 Long Valley Rd
- 23615 Long Valley Rd
- 24044 Long Valley Rd
- 5207 Saddle Creek Rd
- 5329 Blanco Ave
- 24105 Hidden Ridge Rd
- 23760 Oakfield Rd
- 5357 Ellenvale Ave
- 5534 Pattilar Ave
- 24172 Lupin Hill Rd
- 5622 Le Sage Ave
- 23312 Ostronic Dr
- 5155 Orrville Ave
- 5215 Orrville Ave
- 5149 Orrville Ave
- 5225 Orrville Ave
- 5200 Orrville Ave
- 5150 Orrville Ave
- 5139 Orrville Ave
- 5216 Orrville Ave
- 5208 Orrville Ave
- 5222 Orrville Ave
- 5231 Orrville Ave
- 23845 Ladrillo St
- 5135 Orrville Ave
- 23781 Lund St
- 23837 Ladrillo St
- 5125 Orrville Ave
- 23760 Lund St
- 5242 Orrville Ave
- 5130 Orrville Ave
- 23757 Kivik St