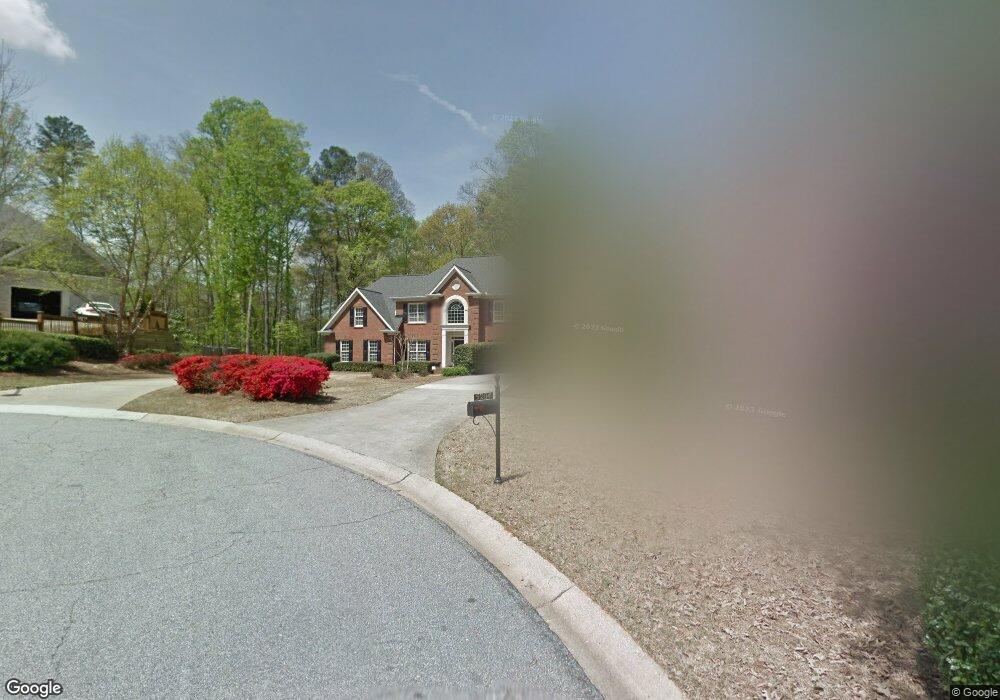
5206 Cardinal Chase SE Smyrna, GA 30082
Estimated Value: $678,567 - $820,000
4
Beds
4
Baths
3,555
Sq Ft
$207/Sq Ft
Est. Value
About This Home
This home is located at 5206 Cardinal Chase SE, Smyrna, GA 30082 and is currently estimated at $737,642, approximately $207 per square foot. 5206 Cardinal Chase SE is a home located in Cobb County with nearby schools including King Springs Elementary School, Griffin Middle School, and Campbell High School.
Ownership History
Date
Name
Owned For
Owner Type
Purchase Details
Closed on
Apr 7, 2021
Sold by
Tobin Benjamin and Lombardi Tobin Sarah
Bought by
Tobin Benjamin Dehn and Lombardi Tobin Sarah
Current Estimated Value
Purchase Details
Closed on
Aug 2, 2019
Sold by
Teague Thomas Charles
Bought by
Tobin Benjamin and Lombardi-Tobin Sarah
Home Financials for this Owner
Home Financials are based on the most recent Mortgage that was taken out on this home.
Original Mortgage
$458,018
Outstanding Balance
$400,268
Interest Rate
3.7%
Mortgage Type
VA
Estimated Equity
$337,374
Purchase Details
Closed on
May 13, 1993
Sold by
Austin Ventures Inc
Bought by
Teague Thomas C
Create a Home Valuation Report for This Property
The Home Valuation Report is an in-depth analysis detailing your home's value as well as a comparison with similar homes in the area
Home Values in the Area
Average Home Value in this Area
Purchase History
| Date | Buyer | Sale Price | Title Company |
|---|---|---|---|
| Tobin Benjamin Dehn | -- | None Available | |
| Tobin Benjamin | $475,000 | -- | |
| Teague Thomas C | $236,000 | -- |
Source: Public Records
Mortgage History
| Date | Status | Borrower | Loan Amount |
|---|---|---|---|
| Open | Tobin Benjamin | $458,018 | |
| Closed | Teague Thomas C | -- |
Source: Public Records
Tax History Compared to Growth
Tax History
| Year | Tax Paid | Tax Assessment Tax Assessment Total Assessment is a certain percentage of the fair market value that is determined by local assessors to be the total taxable value of land and additions on the property. | Land | Improvement |
|---|---|---|---|---|
| 2025 | $7,100 | $311,799 | $80,000 | $231,799 |
| 2024 | $7,539 | $335,268 | $80,000 | $255,268 |
| 2023 | $5,448 | $249,608 | $80,000 | $169,608 |
| 2022 | $4,711 | $182,172 | $36,000 | $146,172 |
| 2021 | $4,613 | $182,172 | $36,000 | $146,172 |
| 2020 | $4,613 | $182,172 | $36,000 | $146,172 |
| 2019 | $214 | $167,868 | $32,000 | $135,868 |
| 2018 | $251 | $151,600 | $32,000 | $119,600 |
| 2017 | $693 | $151,600 | $32,000 | $119,600 |
| 2016 | $696 | $139,328 | $32,000 | $107,328 |
| 2015 | $762 | $139,328 | $32,000 | $107,328 |
| 2014 | $3,234 | $139,328 | $0 | $0 |
Source: Public Records
Map
Nearby Homes
- 538 Micayne Cir SE Unit 3
- 550 Micayne Cir SE Unit 1
- 3538 S Sherwood Rd SE Unit 5
- 4222 Terrace Ct SE
- 436 Concord Rd SE
- 1522 Grace Meadows Ln SE
- 3462 S Sherwood Rd SE
- 629 Dunton Cir SE
- 3375 Emerson St SE
- 3654 Lake Dr SE
- 3568 Lake Dr SE
- 3844 Lake Dr SE
- 3933 N Cooper Lake Rd SE
- 3288 Old Concord Rd SE Unit 1
- 3418 Creek Valley Dr SE
- 317 Highview Dr SE
- 0 Cardinal Chase
- 5205 Cardinal Chase SE
- 5204 Cardinal Chase SE
- 3573 S Sherwood Rd SE
- 5202 Cardinal Chase SE
- 3635 N Cooper Lake Rd SE
- 5203 Cardinal Chase SE
- 3575 S Sherwood Rd SE
- 3625 N Cooper Lake Rd SE
- 3645 N Cooper Lake Rd SE
- 3571 S Sherwood Rd SE
- 3579 S Sherwood Rd SE
- 5201 Cardinal Chase SE Unit 1
- 3655 N Cooper Lake Rd SE
- 2207 Austin Lake Dr SE Unit 1
- 2203 Austin Lake Dr SE Unit 1
- 3569 S Sherwood Rd SE
- 3665 N Cooper Lake Rd SE
- 2209 Austin Lake Dr SE
- 2201 Austin Lake Dr SE Unit 1