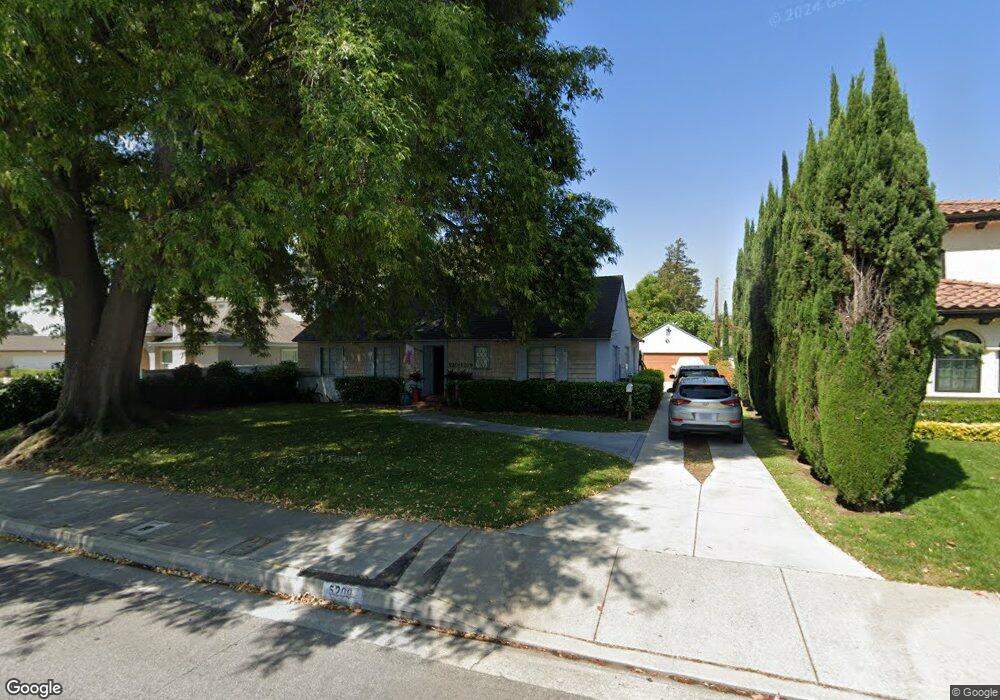
5209 Baldwin Ave Temple City, CA 91780
Estimated Value: $1,054,000 - $1,199,000
3
Beds
2
Baths
1,403
Sq Ft
$805/Sq Ft
Est. Value
About This Home
This home is located at 5209 Baldwin Ave, Temple City, CA 91780 and is currently estimated at $1,129,734, approximately $805 per square foot. 5209 Baldwin Ave is a home located in Los Angeles County with nearby schools including La Rosa Elementary, Oak Avenue Intermediate School, and Temple City High School.
Ownership History
Date
Name
Owned For
Owner Type
Purchase Details
Closed on
May 7, 2012
Sold by
Perrou Barry F and Barry Perrou Living Trust 1993
Bought by
Pedraza Gabriel and Pedraza Jennifer S
Current Estimated Value
Home Financials for this Owner
Home Financials are based on the most recent Mortgage that was taken out on this home.
Original Mortgage
$490,943
Interest Rate
3.87%
Mortgage Type
FHA
Purchase Details
Closed on
Jul 15, 1995
Sold by
Perrou Barry
Bought by
Perrou Barry F and Barry Perrou Living Trust 1993
Purchase Details
Closed on
Apr 21, 1995
Sold by
Wallace Linda
Bought by
Wallace Linda Jean and The Linda Jean Wallace Revocab
Purchase Details
Closed on
Nov 4, 1994
Sold by
Perrou Barry and Perrou Family Trust
Bought by
Perrou Barry and Wallace Linda
Purchase Details
Closed on
Mar 15, 1994
Sold by
Perrou Barry and Perrou Emmanuel
Bought by
Perrou Barry and Perrou Family By Pass Trust
Create a Home Valuation Report for This Property
The Home Valuation Report is an in-depth analysis detailing your home's value as well as a comparison with similar homes in the area
Home Values in the Area
Average Home Value in this Area
Purchase History
| Date | Buyer | Sale Price | Title Company |
|---|---|---|---|
| Pedraza Gabriel | $500,000 | Lawyers Title | |
| Perrou Barry F | -- | -- | |
| Wallace Linda Jean | -- | -- | |
| Perrou Barry | -- | -- | |
| Perrou Barry | -- | -- |
Source: Public Records
Mortgage History
| Date | Status | Borrower | Loan Amount |
|---|---|---|---|
| Previous Owner | Pedraza Gabriel | $490,943 |
Source: Public Records
Tax History
| Year | Tax Paid | Tax Assessment Tax Assessment Total Assessment is a certain percentage of the fair market value that is determined by local assessors to be the total taxable value of land and additions on the property. | Land | Improvement |
|---|---|---|---|---|
| 2025 | $7,420 | $615,706 | $492,568 | $123,138 |
| 2024 | $7,420 | $603,634 | $482,910 | $120,724 |
| 2023 | $7,253 | $591,799 | $473,442 | $118,357 |
| 2022 | $6,792 | $580,196 | $464,159 | $116,037 |
| 2021 | $6,915 | $568,820 | $455,058 | $113,762 |
| 2019 | $6,669 | $551,950 | $441,561 | $110,389 |
| 2018 | $6,497 | $541,128 | $432,903 | $108,225 |
| 2016 | $6,228 | $520,117 | $416,094 | $104,023 |
| 2015 | $6,124 | $512,305 | $409,844 | $102,461 |
| 2014 | $6,038 | $502,270 | $401,816 | $100,454 |
Source: Public Records
Map
Nearby Homes
- 9942 Howland Dr
- 5109 Baldwin Ave
- 9855 La Rosa Dr
- 5122 Ardenel Ave
- 4918 Baldwin Ave
- 5313 Golden West Ave
- 5016 Golden West Ave
- 5001 Glickman Ave
- 5224 Hallowell Ave
- 4825 Arden Dr
- 9628 Broadway
- 10159 Bogue St
- 5111 Halifax Rd
- 5023 Temple City Blvd
- 4840 Temple City Blvd
- 5122 Halifax Rd
- 5544 Temple City Blvd
- 5538 Temple City Blvd
- 5556 Temple City Blvd
- 4847 Ardsley Dr
- 9969 Miloann St
- 5219 Baldwin Ave
- 5223 Baldwin Ave
- 5210 Willmonte Ave
- 5216 Willmonte Ave
- 5204 Willmonte Ave
- 5139 Baldwin Ave
- 5226 Willmonte Ave
- 5231 Baldwin Ave
- 9916 Miloann St
- 5232 Willmonte Ave
- 9950 Miloann St
- 5140 Baldwin Ave
- 5131 Baldwin Ave
- 5239 Baldwin Ave
- 5301 Village Circle R 6 Dr Unit 6
- 9944 Miloann St
- 10014 Green St
- 5125 Baldwin Ave
- 9931 Miloann St
Your Personal Tour Guide
Ask me questions while you tour the home.