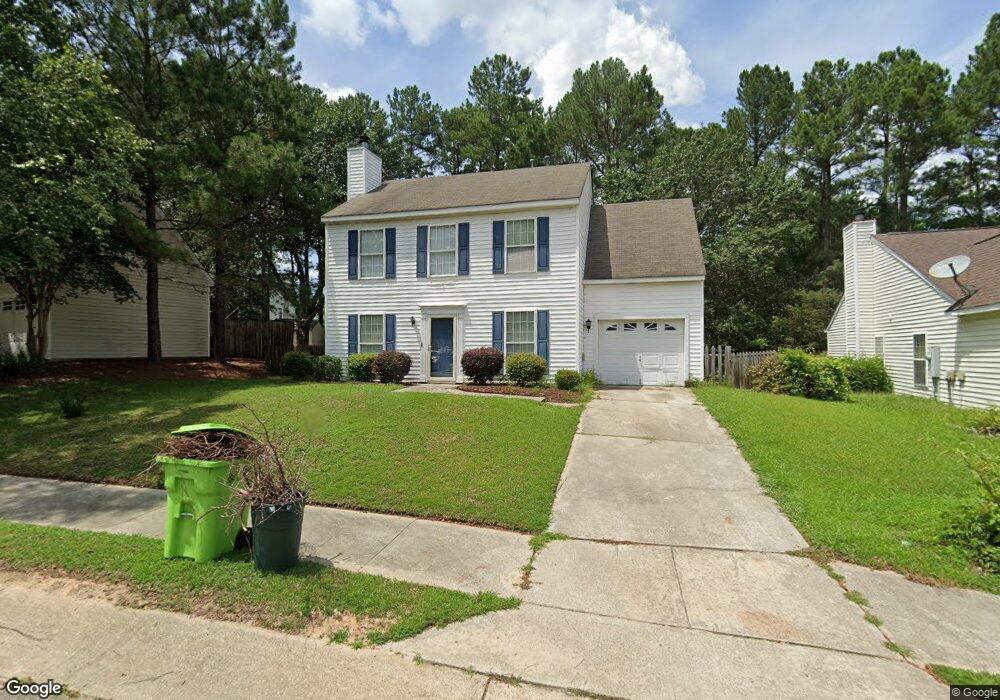
5209 Cottage Oaks Ln Raleigh, NC 27616
Northeast Raleigh NeighborhoodEstimated Value: $330,000 - $363,000
3
Beds
3
Baths
1,656
Sq Ft
$208/Sq Ft
Est. Value
About This Home
This home is located at 5209 Cottage Oaks Ln, Raleigh, NC 27616 and is currently estimated at $344,564, approximately $208 per square foot. 5209 Cottage Oaks Ln is a home located in Wake County with nearby schools including Harris Creek Elementary School, River Bend Middle, and Rolesville High School.
Ownership History
Date
Name
Owned For
Owner Type
Purchase Details
Closed on
May 12, 2017
Sold by
Kirkwood Amy
Bought by
Ibrahim Eman R
Current Estimated Value
Home Financials for this Owner
Home Financials are based on the most recent Mortgage that was taken out on this home.
Original Mortgage
$121,000
Outstanding Balance
$100,737
Interest Rate
4.14%
Mortgage Type
New Conventional
Estimated Equity
$243,827
Purchase Details
Closed on
Jun 15, 2009
Sold by
Sirva Relocation Properties Llc
Bought by
Kirkwood Amy
Home Financials for this Owner
Home Financials are based on the most recent Mortgage that was taken out on this home.
Original Mortgage
$123,120
Interest Rate
4.77%
Mortgage Type
New Conventional
Purchase Details
Closed on
Dec 14, 2001
Sold by
Simon Daniel L and Simon Sarah Lauren
Bought by
Berry Ii Jon S and Berry Gail H
Home Financials for this Owner
Home Financials are based on the most recent Mortgage that was taken out on this home.
Original Mortgage
$102,400
Interest Rate
6.5%
Create a Home Valuation Report for This Property
The Home Valuation Report is an in-depth analysis detailing your home's value as well as a comparison with similar homes in the area
Home Values in the Area
Average Home Value in this Area
Purchase History
| Date | Buyer | Sale Price | Title Company |
|---|---|---|---|
| Ibrahim Eman R | $186,000 | None Available | |
| Kirkwood Amy | $154,000 | None Available | |
| Sirva Relocation Properties Llc | $154,000 | None Available | |
| Berry Ii Jon S | $128,000 | -- |
Source: Public Records
Mortgage History
| Date | Status | Borrower | Loan Amount |
|---|---|---|---|
| Open | Ibrahim Eman R | $121,000 | |
| Previous Owner | Sirva Relocation Properties Llc | $123,120 | |
| Previous Owner | Berry Ii Jon S | $102,400 | |
| Closed | Berry Ii Jon S | $12,800 |
Source: Public Records
Tax History Compared to Growth
Tax History
| Year | Tax Paid | Tax Assessment Tax Assessment Total Assessment is a certain percentage of the fair market value that is determined by local assessors to be the total taxable value of land and additions on the property. | Land | Improvement |
|---|---|---|---|---|
| 2025 | $2,906 | $330,949 | $110,000 | $220,949 |
| 2024 | $2,894 | $330,949 | $110,000 | $220,949 |
| 2023 | $2,374 | $215,954 | $52,000 | $163,954 |
| 2022 | $2,207 | $215,954 | $52,000 | $163,954 |
| 2021 | $2,121 | $215,954 | $52,000 | $163,954 |
| 2020 | $2,083 | $215,954 | $52,000 | $163,954 |
| 2019 | $1,820 | $155,340 | $36,000 | $119,340 |
| 2018 | $1,717 | $155,340 | $36,000 | $119,340 |
| 2017 | $1,636 | $155,340 | $36,000 | $119,340 |
| 2016 | $1,603 | $155,340 | $36,000 | $119,340 |
| 2015 | $1,628 | $155,277 | $36,000 | $119,277 |
| 2014 | $1,545 | $155,277 | $36,000 | $119,277 |
Source: Public Records
Map
Nearby Homes
- 5200 Fieldwood Ct
- 5012 Silverdene St
- 5325 Marthonna Way
- 4800 Arbor Lodge Dr
- 4804 Spring Forest Rd
- 4625 Fox Rd
- 5920 Holly Dr
- 4821 Heathshire Dr
- 4804 Tolley Ct
- 5320 Spring Pines Way
- 4809 Kaycee Ct
- 5208 Windmere Chase Dr
- 5321 Glass Ridge Rd
- 5915 River Landings Dr
- 5708 Sea Fox Ct
- 4416 Walker Hallow St
- 4416 Brintons Cottage St
- 4429 Log Cabin Dr
- 4508 Brintons Cottage St
- 4809 Elmhurst Ridge Ct
- 5205 Cottage Oaks Ln
- 5217 Cottage Oaks Ln
- 5204 Fieldwood Ct
- 5221 Cottage Oaks Ln
- 5201 Cottage Oaks Ln
- 5208 Fieldwood Ct
- 5208 Cottage Oaks Ln
- 5212 Cottage Oaks Ln
- 5204 Cottage Oaks Ln
- 5225 Cottage Oaks Ln
- 5200 Cottage Oaks Ln
- 5216 Cottage Oaks Ln
- 5209 Fieldwood Ct
- 5515 Cardinal Grove Blvd
- 5509 Cardinal Grove Blvd
- 5505 Cardinal Grove Blvd
- 5519 Cardinal Grove Blvd
- 6000 Cardinal Grove Blvd
- 5415 Arbor Oak Ln
- 5220 Cottage Oaks Ln