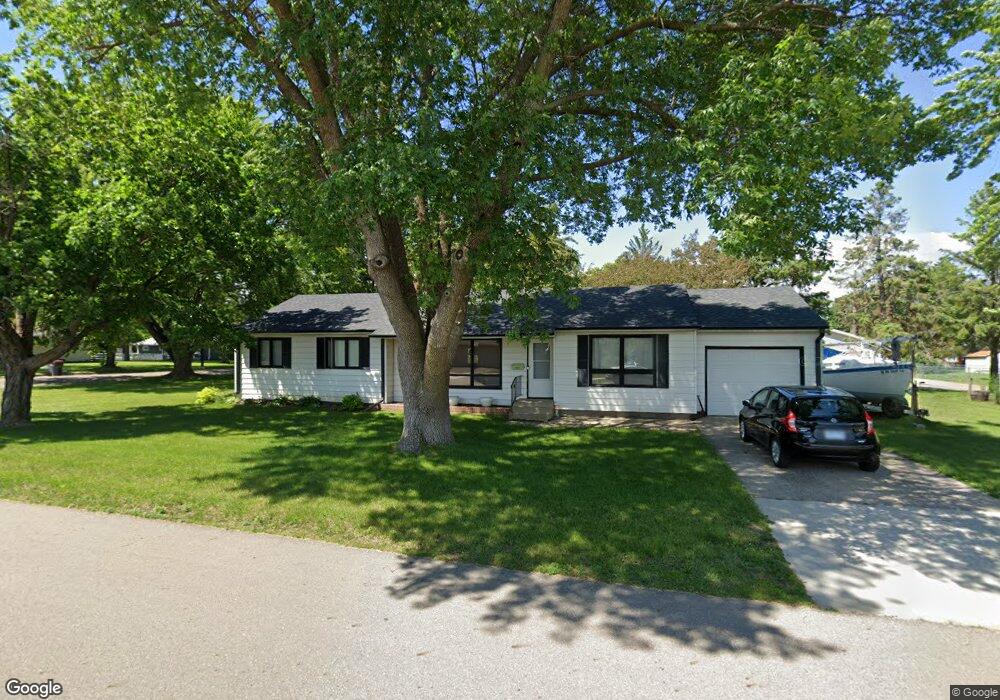
521 17th Ave W Alexandria, MN 56308
Estimated Value: $233,936 - $256,000
4
Beds
2
Baths
2,391
Sq Ft
$103/Sq Ft
Est. Value
About This Home
This home is located at 521 17th Ave W, Alexandria, MN 56308 and is currently estimated at $246,234, approximately $102 per square foot. 521 17th Ave W is a home located in Douglas County with nearby schools including Lincoln Elementary School, Discovery Middle School, and Alexandria Area High School.
Ownership History
Date
Name
Owned For
Owner Type
Purchase Details
Closed on
May 11, 2018
Sold by
Burnham Gregory L and Burnham Jennifer A
Bought by
Gerhardt Jospeh A
Current Estimated Value
Home Financials for this Owner
Home Financials are based on the most recent Mortgage that was taken out on this home.
Original Mortgage
$145,400
Outstanding Balance
$125,194
Interest Rate
4.4%
Mortgage Type
New Conventional
Estimated Equity
$121,040
Purchase Details
Closed on
Aug 18, 2017
Sold by
Burnham Ronald D and Burnham Karen Y
Bought by
Burnham Gregory L
Purchase Details
Closed on
Oct 22, 2015
Sold by
Shamp Jeremy C and Shamp Kimberly D
Bought by
Burnham Ronald E and Burnham Karen Y
Home Financials for this Owner
Home Financials are based on the most recent Mortgage that was taken out on this home.
Original Mortgage
$55,000
Interest Rate
3.87%
Mortgage Type
Future Advance Clause Open End Mortgage
Create a Home Valuation Report for This Property
The Home Valuation Report is an in-depth analysis detailing your home's value as well as a comparison with similar homes in the area
Home Values in the Area
Average Home Value in this Area
Purchase History
| Date | Buyer | Sale Price | Title Company |
|---|---|---|---|
| Gerhardt Jospeh A | $158,400 | Integrity Title | |
| Burnham Gregory L | -- | None Available | |
| Burnham Ronald E | $98,500 | Integrity Title Inc |
Source: Public Records
Mortgage History
| Date | Status | Borrower | Loan Amount |
|---|---|---|---|
| Open | Gerhardt Jospeh A | $145,400 | |
| Previous Owner | Burnham Ronald E | $55,000 |
Source: Public Records
Tax History Compared to Growth
Tax History
| Year | Tax Paid | Tax Assessment Tax Assessment Total Assessment is a certain percentage of the fair market value that is determined by local assessors to be the total taxable value of land and additions on the property. | Land | Improvement |
|---|---|---|---|---|
| 2025 | $1,876 | $207,200 | $41,000 | $166,200 |
| 2024 | $1,876 | $175,900 | $39,000 | $136,900 |
| 2023 | $1,820 | $160,900 | $39,000 | $121,900 |
| 2022 | $1,728 | $145,700 | $36,300 | $109,400 |
| 2021 | $1,658 | $135,000 | $36,300 | $98,700 |
| 2020 | $1,638 | $127,100 | $36,300 | $90,800 |
| 2019 | $1,236 | $121,600 | $36,300 | $85,300 |
| 2018 | $1,118 | $116,000 | $36,300 | $79,700 |
| 2017 | $1,050 | $110,500 | $36,300 | $74,200 |
| 2016 | $1,042 | $104,275 | $35,114 | $69,161 |
| 2015 | $1,036 | $0 | $0 | $0 |
| 2014 | -- | $100,500 | $36,200 | $64,300 |
Source: Public Records
Map
Nearby Homes
- 1424 Ash St
- 1405 Bryant St
- 1407 Elm St
- 1122 Fillmore St
- 1019 Ash St
- 1014 Elm St
- 1410 Jefferson St
- XXXX 18th Ave E
- 1225 Irving St
- 1023 Hawthorne St
- 1017 Hawthorne St
- 2212 Jefferson St
- 9xx 22nd Ave E
- 10xx 22nd Ave E
- 1105 Jefferson St
- 00 30th Ave
- 1119 Kenwood St
- 410 10th Ave E
- 301 8th Ave E
- 1415 Lake St Unit 105