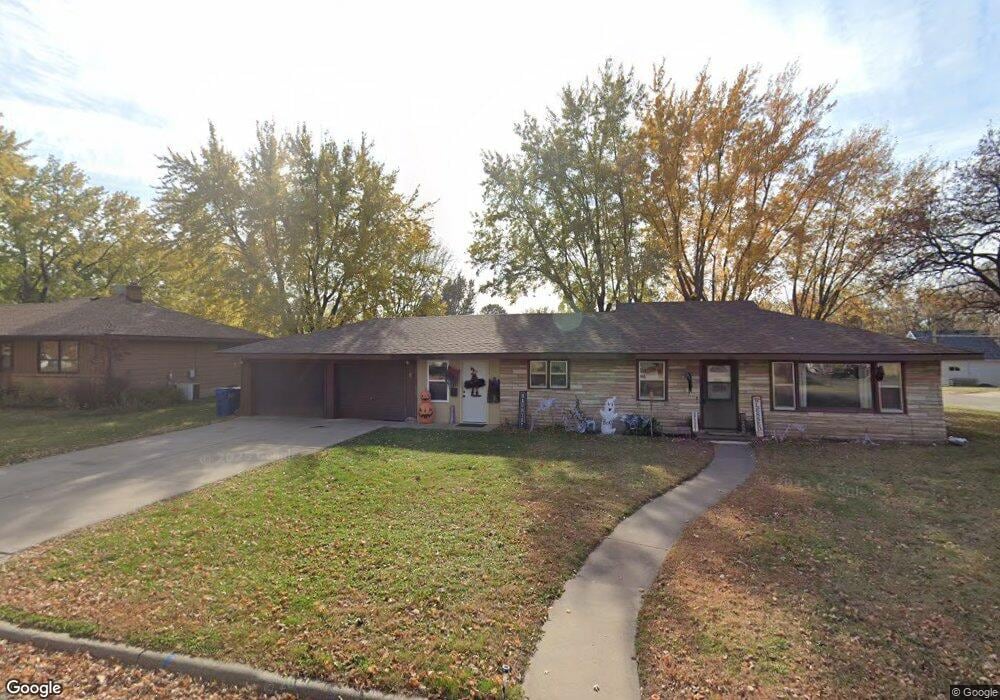
521 5th Ave N Sauk Rapids, MN 56379
Estimated Value: $221,000 - $237,000
3
Beds
1
Bath
1,200
Sq Ft
$192/Sq Ft
Est. Value
About This Home
This home is located at 521 5th Ave N, Sauk Rapids, MN 56379 and is currently estimated at $230,469, approximately $192 per square foot. 521 5th Ave N is a home located in Benton County with nearby schools including Pleasant View Elementary School, Sauk Rapids-Rice Middle School, and Sauk Rapids-Rice Senior High School.
Ownership History
Date
Name
Owned For
Owner Type
Purchase Details
Closed on
Mar 11, 2022
Sold by
Lenarz Aaron and Lenarz Jamie
Bought by
Solway Christopher
Current Estimated Value
Home Financials for this Owner
Home Financials are based on the most recent Mortgage that was taken out on this home.
Original Mortgage
$195,000
Outstanding Balance
$182,193
Interest Rate
3.92%
Mortgage Type
New Conventional
Estimated Equity
$48,276
Purchase Details
Closed on
Mar 10, 2022
Sold by
Lenarz and Jamie
Bought by
Solway Christopher
Home Financials for this Owner
Home Financials are based on the most recent Mortgage that was taken out on this home.
Original Mortgage
$195,000
Outstanding Balance
$182,193
Interest Rate
3.92%
Mortgage Type
New Conventional
Estimated Equity
$48,276
Purchase Details
Closed on
Dec 10, 2012
Sold by
Tischbirek George J and Tischbirek Cheryl A
Bought by
Lenarz Aaron and Lenarz Jamie
Home Financials for this Owner
Home Financials are based on the most recent Mortgage that was taken out on this home.
Original Mortgage
$91,315
Interest Rate
3.25%
Mortgage Type
FHA
Create a Home Valuation Report for This Property
The Home Valuation Report is an in-depth analysis detailing your home's value as well as a comparison with similar homes in the area
Home Values in the Area
Average Home Value in this Area
Purchase History
| Date | Buyer | Sale Price | Title Company |
|---|---|---|---|
| Solway Christopher | $195,000 | -- | |
| Solway Christopher | $195,000 | Burnet Title | |
| Lenarz Aaron | $93,000 | Tri County Abstract & Title |
Source: Public Records
Mortgage History
| Date | Status | Borrower | Loan Amount |
|---|---|---|---|
| Open | Solway Christopher | $195,000 | |
| Closed | Solway Christopher | $195,000 | |
| Previous Owner | Lenarz Aaron | $91,315 |
Source: Public Records
Tax History Compared to Growth
Tax History
| Year | Tax Paid | Tax Assessment Tax Assessment Total Assessment is a certain percentage of the fair market value that is determined by local assessors to be the total taxable value of land and additions on the property. | Land | Improvement |
|---|---|---|---|---|
| 2025 | $669 | $187,200 | $32,000 | $155,200 |
| 2024 | $867 | $179,700 | $32,000 | $147,700 |
| 2023 | $10 | $182,100 | $32,000 | $150,100 |
| 2022 | $1,796 | $161,900 | $29,100 | $132,800 |
| 2021 | $2,004 | $142,400 | $29,100 | $113,300 |
| 2018 | $1,416 | $93,300 | $21,806 | $71,494 |
| 2017 | $1,416 | $85,300 | $21,249 | $64,051 |
| 2016 | $1,376 | $109,300 | $28,000 | $81,300 |
| 2015 | $1,388 | $74,900 | $20,381 | $54,519 |
| 2014 | -- | $70,800 | $20,004 | $50,796 |
| 2013 | -- | $72,000 | $20,120 | $51,880 |
Source: Public Records
Map
Nearby Homes
- 615 3rd Ave N
- 117 6th Ave N
- 224 9th St N
- 216 8th Ave N
- 314 Pleasant Ridge Dr
- 1101 10th Ave N
- 1018 N Benton Dr
- 1107 10th Ave N
- 752 12th St N
- 32467 County Road 1
- 1201 10th Ave N
- 1105 Summit Ave N
- 112 Summit Ave S
- 702 N Benton Dr
- 709 N Benton Dr
- 2161 Mill Pond Dr
- 3322 321st St
- 3300 321st St
- 1209 Millstone Ct
- 100 9th Ave S
- 521 521 5th-Avenue-n
- 513 5th Ave N
- 601 5th Ave N
- 520 4th Ave N
- 516 4th Ave N
- 429 5th St N
- 510 4th Ave N
- 429 429 5th-Street-n
- 520 520 5th-Avenue-n
- 516 5th Ave N
- 520 5th Ave N
- 605 5th Ave N
- 600 5th Ave N
- 512 5th Ave N
- 405 6th St N
- 508 5th Ave N
- 604 604 5th-Avenue-n
- 608 4th Ave N
- 604 5th Ave N
- 500 4th Ave N